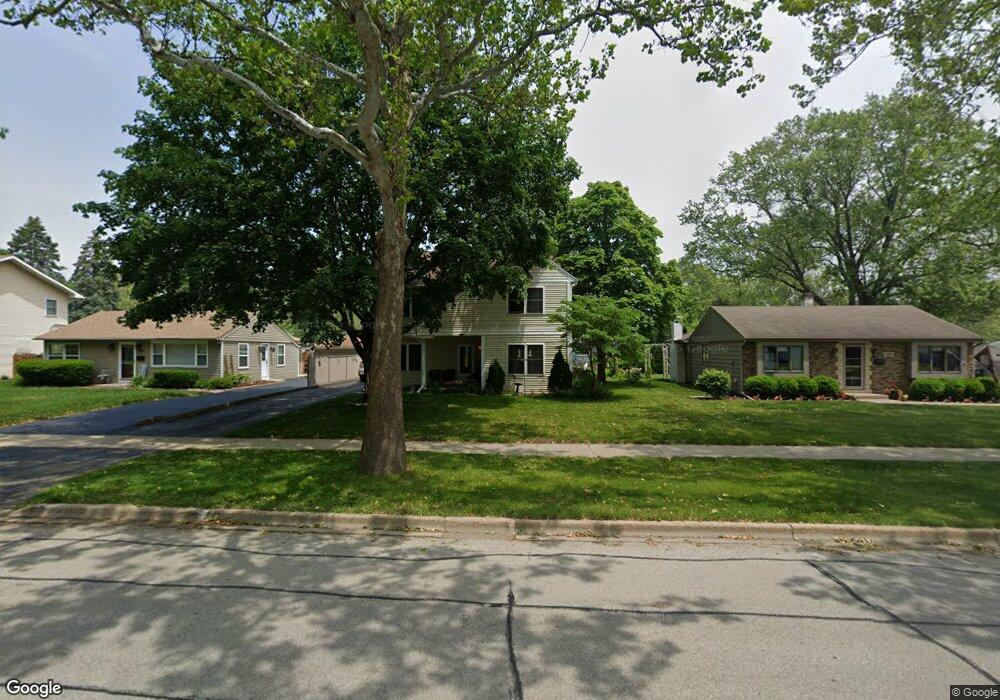
3706 Meadow Dr Rolling Meadows, IL 60008
Estimated Value: $361,000 - $413,000
3
Beds
2
Baths
1,628
Sq Ft
$239/Sq Ft
Est. Value
About This Home
This home is located at 3706 Meadow Dr, Rolling Meadows, IL 60008 and is currently estimated at $388,807, approximately $238 per square foot. 3706 Meadow Dr is a home located in Cook County with nearby schools including Kimball Hill Elementary School, Carl Sandburg Junior High School, and Rolling Meadows High School.
Ownership History
Date
Name
Owned For
Owner Type
Purchase Details
Closed on
Jan 9, 2020
Sold by
Naymola Stanley J and Naymola Donna L
Bought by
Naymola Stanley J and Naymola Donna
Current Estimated Value
Create a Home Valuation Report for This Property
The Home Valuation Report is an in-depth analysis detailing your home's value as well as a comparison with similar homes in the area
Home Values in the Area
Average Home Value in this Area
Purchase History
| Date | Buyer | Sale Price | Title Company |
|---|---|---|---|
| Naymola Stanley J | -- | None Available |
Source: Public Records
Tax History
| Year | Tax Paid | Tax Assessment Tax Assessment Total Assessment is a certain percentage of the fair market value that is determined by local assessors to be the total taxable value of land and additions on the property. | Land | Improvement |
|---|---|---|---|---|
| 2025 | $6,312 | $38,000 | $5,070 | $32,930 |
| 2024 | $6,312 | $26,561 | $4,290 | $22,271 |
| 2023 | $5,989 | $26,561 | $4,290 | $22,271 |
| 2022 | $5,989 | $26,561 | $4,290 | $22,271 |
| 2021 | $4,986 | $21,050 | $2,535 | $18,515 |
| 2020 | $5,804 | $21,050 | $2,535 | $18,515 |
| 2019 | $5,845 | $23,520 | $2,535 | $20,985 |
| 2018 | $7,029 | $25,138 | $2,340 | $22,798 |
| 2017 | $6,905 | $25,138 | $2,340 | $22,798 |
| 2016 | $6,693 | $25,138 | $2,340 | $22,798 |
| 2015 | $5,412 | $19,811 | $2,145 | $17,666 |
| 2014 | $5,299 | $19,811 | $2,145 | $17,666 |
| 2013 | $5,154 | $19,811 | $2,145 | $17,666 |
Source: Public Records
Map
Nearby Homes
- 3101 Thrush Ln
- 2404 Hawk Ln
- 3610 Pheasant Dr
- 3200 Thrush Ln
- 2707 Lily Ln
- 2720 Lily Ln
- 3717 Oriole Ln
- 3306 Trillium Cir Unit 3001
- 2201 Kingfisher Ln
- 3100 Town Square Dr Unit 308
- 3135 Town Square Dr Unit 104
- 3135 Town Square Dr Unit 407
- 503 Lexington Ln
- 3503 Bobolink Ln
- 2109 Park St
- 2308 Park St
- 3502 Mallard Ct
- 3265 Kirchoff Rd Unit 116
- 2950 Northampton Dr Unit B2
- 2830 Northampton Dr Unit A1
Your Personal Tour Guide
Ask me questions while you tour the home.