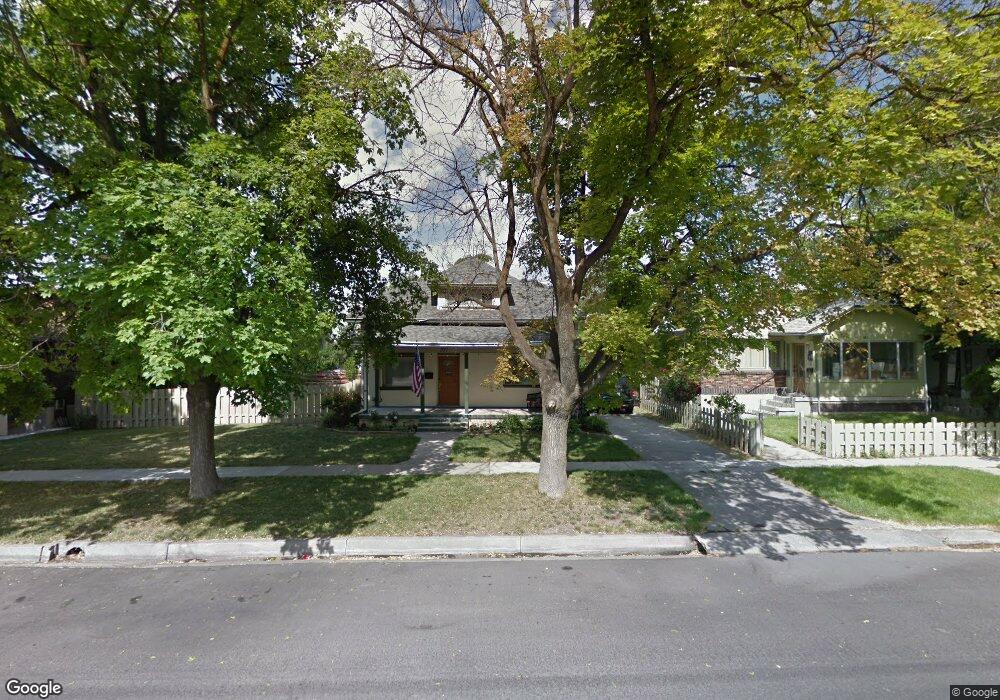
371 N 400 W Provo, UT 84601
Rivergrove NeighborhoodEstimated Value: $480,620 - $612,000
About This Home
This home is located at 371 N 400 W, Provo, UT 84601 and is currently estimated at $541,155, approximately $277 per square foot. 371 N 400 W is a home located in Utah County with nearby schools including Timpanogos Elementary School, Dixon Middle School, and Provo High School.
Ownership History
We collect this data history from publicly available records. To have your information removed, we recommend requesting removal directly through your county’s website.
Purchase Details
Home Financials for this Owner
Home Financials are based on the most recent Mortgage that was taken out on this home.Purchase Details
Home Financials for this Owner
Home Financials are based on the most recent Mortgage that was taken out on this home.Purchase Details
Home Financials for this Owner
Home Financials are based on the most recent Mortgage that was taken out on this home.Purchase Details
Purchase Details
Purchase Details
Home Financials for this Owner
Home Financials are based on the most recent Mortgage that was taken out on this home.Home Values in the Area
Average Home Value in this Area
Purchase History
We collect this data history from publicly available records. To have your information removed, we recommend requesting removal directly through your county’s website.
| Date | Buyer | Sale Price | Title Company |
|---|---|---|---|
| -- | Pro Title & Escrow Inc | ||
| -- | Pro Title And Escrow Inc | ||
| -- | Empire Land Title Inc | ||
| -- | Old Republic Title Company | ||
| -- | Empire Land Title Company | ||
| $121,071 | -- | ||
| -- | Equity Title Agency Inc |
Mortgage History
We collect this data history from publicly available records. To have your information removed, we recommend requesting removal directly through your county’s website.
| Date | Status | Borrower | Loan Amount |
|---|---|---|---|
| Open | $113,900 | ||
| Closed | $150,490 | ||
| Previous Owner | $136,111 | ||
| Previous Owner | $111,600 |
Tax History
We collect this data history from publicly available records. To have your information removed, we recommend requesting removal directly through your county’s website.
| Year | Tax Paid | Tax Assessment Tax Assessment Total Assessment is a certain percentage of the fair market value that is determined by local assessors to be the total taxable value of land and additions on the property. | Land | Improvement |
|---|---|---|---|---|
| 2025 | $2,396 | $235,015 | -- | -- |
| 2024 | $2,396 | $235,840 | $0 | $0 |
| 2023 | $2,518 | $244,365 | $0 | $0 |
| 2022 | $2,293 | $224,400 | $0 | $0 |
| 2021 | $1,756 | $299,700 | $95,400 | $204,300 |
| 2020 | $1,703 | $272,400 | $86,700 | $185,700 |
| 2019 | $1,492 | $248,200 | $86,700 | $161,500 |
| 2018 | $1,326 | $223,700 | $83,300 | $140,400 |
| 2017 | $1,280 | $118,690 | $0 | $0 |
| 2016 | $1,273 | $110,055 | $0 | $0 |
| 2015 | $1,133 | $98,945 | $0 | $0 |
| 2014 | $930 | $84,645 | $0 | $0 |
Map
- 455 N 400 St W Unit 25
- 344 W 300 N
- 270 N 400 W
- 465 N 300 W Unit 29
- 465 N 300 W Unit 19
- 343 W 300 N Unit 9
- 475 N 300 W Unit 10
- 226 N 300 W
- 266 N 700 W
- 75 N 600 W
- 710 W 100 N
- 250 N 100 W Unit 116
- 250 N 100 W Unit 108
- 250 N 100 W Unit 109
- 250 N 100 W Unit 118
- 72 W 300 N Unit 301
- 80 N 700 W
- 363 W 800 N
- 596 N 800 W
- 754 W 100 N
Ask me questions while you tour the home.