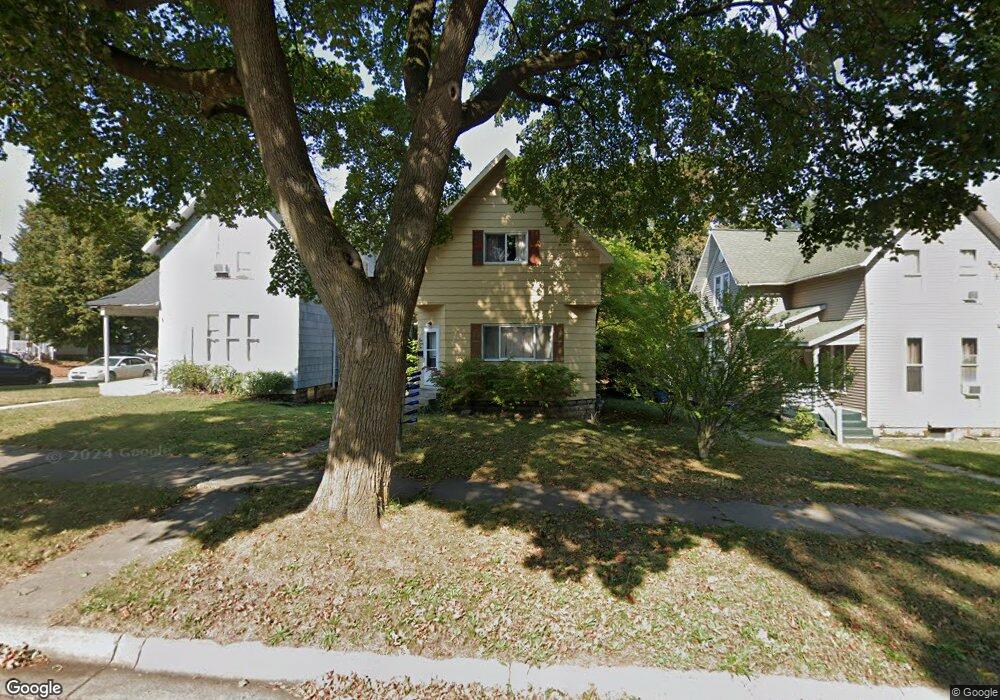
372 3rd St Manistee, MI 49660
Estimated Value: $158,000 - $206,000
3
Beds
1
Bath
1,600
Sq Ft
$109/Sq Ft
Est. Value
About This Home
This home is located at 372 3rd St, Manistee, MI 49660 and is currently estimated at $174,084, approximately $108 per square foot. 372 3rd St is a home located in Manistee County with nearby schools including John F. Kennedy Elementary School, Thomas Jefferson Elementary School, and Manistee Middle / High School.
Ownership History
Date
Name
Owned For
Owner Type
Purchase Details
Closed on
Sep 23, 2021
Sold by
American Note Capital Llc
Bought by
Slater & Company 401K Pension
Current Estimated Value
Purchase Details
Closed on
Jan 27, 2011
Sold by
Federal National Mortgage Assoc
Bought by
Harbour Portfolio Vi Lp
Purchase Details
Closed on
Nov 2, 2010
Sold by
Northwestern Mortgage Company
Bought by
Federal National Mortgage Assoc
Purchase Details
Closed on
Sep 17, 2010
Sold by
Madsen Sandra J
Bought by
Northwestern Mortgage Company
Purchase Details
Closed on
Nov 1, 1993
Create a Home Valuation Report for This Property
The Home Valuation Report is an in-depth analysis detailing your home's value as well as a comparison with similar homes in the area
Home Values in the Area
Average Home Value in this Area
Purchase History
| Date | Buyer | Sale Price | Title Company |
|---|---|---|---|
| Slater & Company 401K Pension | -- | -- | |
| Harbour Portfolio Vi Lp | $11,000 | -- | |
| Federal National Mortgage Assoc | -- | -- | |
| Northwestern Mortgage Company | -- | -- | |
| -- | -- | -- |
Source: Public Records
Tax History
| Year | Tax Paid | Tax Assessment Tax Assessment Total Assessment is a certain percentage of the fair market value that is determined by local assessors to be the total taxable value of land and additions on the property. | Land | Improvement |
|---|---|---|---|---|
| 2025 | $1,299 | $66,800 | $0 | $0 |
| 2024 | $13 | $56,500 | $0 | $0 |
| 2023 | $1,221 | $52,200 | $0 | $0 |
| 2022 | $2,012 | $43,500 | $43,500 | $0 |
| 2021 | $1,957 | $37,700 | $37,700 | $0 |
| 2020 | $1,851 | $31,200 | $31,200 | $0 |
| 2019 | $1,575 | $26,400 | $26,400 | $0 |
| 2018 | $1,641 | $27,400 | $27,400 | $0 |
| 2017 | $1,539 | $26,300 | $26,300 | $0 |
| 2016 | $921 | $26,500 | $26,500 | $0 |
| 2015 | -- | $25,400 | $25,400 | $0 |
| 2014 | -- | $29,700 | $0 | $0 |
Source: Public Records
Map
Nearby Homes
Your Personal Tour Guide
Ask me questions while you tour the home.