Estimated Value: $389,454 - $596,000
4
Beds
2
Baths
1,440
Sq Ft
$342/Sq Ft
Est. Value
About This Home
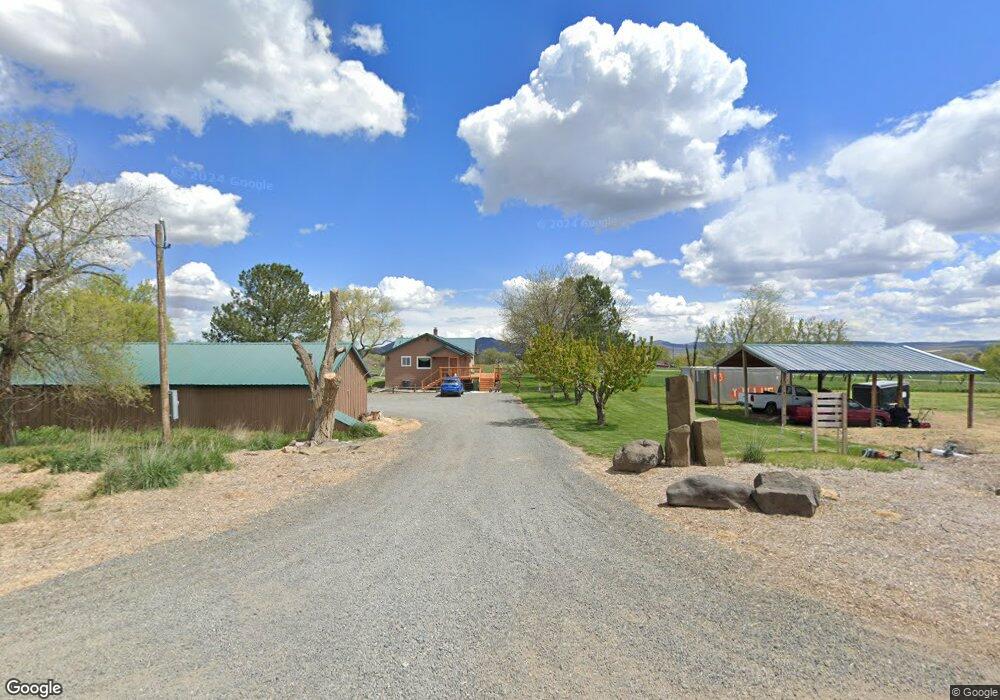
This home is located at 3722 W Cedar Rd, Vale, OR 97918 and is currently estimated at $492,727, approximately $342 per square foot. 3722 W Cedar Rd is a home located in Malheur County with nearby schools including Vale Middle School and Vale High School.
Ownership History
Date
Name
Owned For
Owner Type
Purchase Details
Closed on
Feb 23, 2022
Sold by
Whitaker and Ruth
Bought by
Whitaker Matthew and Whitaker Lindy
Current Estimated Value
Purchase Details
Closed on
Oct 4, 2018
Sold by
Whitaker Lowell and Whitaker Ruth
Bought by
Whitaker Lowell and Whitaker Ruth
Purchase Details
Closed on
Jun 19, 2018
Sold by
Kelly Donna M and Padilla Donna Kelly
Bought by
Whitaker Lowell and Whitaker Ruth
Home Financials for this Owner
Home Financials are based on the most recent Mortgage that was taken out on this home.
Original Mortgage
$208,000
Interest Rate
4.5%
Mortgage Type
New Conventional
Create a Home Valuation Report for This Property
The Home Valuation Report is an in-depth analysis detailing your home's value as well as a comparison with similar homes in the area
Purchase History
| Date | Buyer | Sale Price | Title Company |
|---|---|---|---|
| Whitaker Matthew | -- | None Listed On Document | |
| Whitaker Lowell | -- | Malheur County Title Company | |
| Whitaker Lowell | $260,000 | Malheur County Title Company |
Source: Public Records
Mortgage History
| Date | Status | Borrower | Loan Amount |
|---|---|---|---|
| Previous Owner | Whitaker Lowell | $208,000 |
Source: Public Records
Tax History
| Year | Tax Paid | Tax Assessment Tax Assessment Total Assessment is a certain percentage of the fair market value that is determined by local assessors to be the total taxable value of land and additions on the property. | Land | Improvement |
|---|---|---|---|---|
| 2025 | $1,696 | $162,986 | $15,625 | $147,361 |
| 2024 | $1,662 | $158,376 | $15,307 | $143,069 |
| 2023 | $1,607 | $153,899 | $14,997 | $138,902 |
| 2022 | $1,566 | $149,554 | $14,697 | $134,857 |
| 2021 | $1,599 | $145,336 | $14,406 | $130,930 |
| 2020 | $1,481 | $141,240 | $14,123 | $127,117 |
| 2019 | $1,463 | $137,264 | $13,849 | $123,415 |
| 2018 | $1,434 | $133,403 | $13,582 | $119,821 |
| 2017 | $1,373 | $129,654 | $13,322 | $116,332 |
| 2016 | $1,274 | $126,016 | $13,072 | $112,944 |
| 2015 | $1,284 | $122,437 | $12,782 | $109,655 |
| 2014 | $1,250 | $119,052 | $12,590 | $106,462 |
Source: Public Records
Map
Nearby Homes
- 1925 Graham Blvd
- 3850 Greenfield Rd
- 1875 McLay Rd
- 1853 McLay Rd
- 2175 Graham Blvd
- 1111 D St W
- 1394 Morton St W
- 983 South St
- 885 Airport Rd
- 749 Ritter Ave
- TBD Thousand Springs Rd
- 710 Smith St S
- 1200 Hoffman Dr
- TBD W E St
- 555 15th St
- 3580 Greenfield Rd
- 555 14th St
- 188 Morton St W
- 233 Glenn St S
- 1780 Sand Hollow Rd
- 1986 Bench Rd
- 2019 Bench Rd
- 3729 W Cedar Rd
- 1975 Bench Rd
- 3753 W Cedar Rd
- 1958 Bench Rd
- 3762 W Cedar Rd
- 3660 W Cedar Rd
- 3767 W Cedar Rd
- 1954 Bench Rd
- 1199 Hoffman Dr
- 3763 W Cedar Rd
- 2056 Bench Rd
- 1949 Bench Rd
- 3765 W Cedar Rd
- 3665 W Cedar Rd
- 2073 Bench Rd
- 1932 Bench Rd
- 1935 Bench Rd
- 1971 Graham Blvd
Your Personal Tour Guide
Ask me questions while you tour the home.