373 N Main St Fall River, MA 02720
Lower Highlands NeighborhoodEstimated Value: $777,466
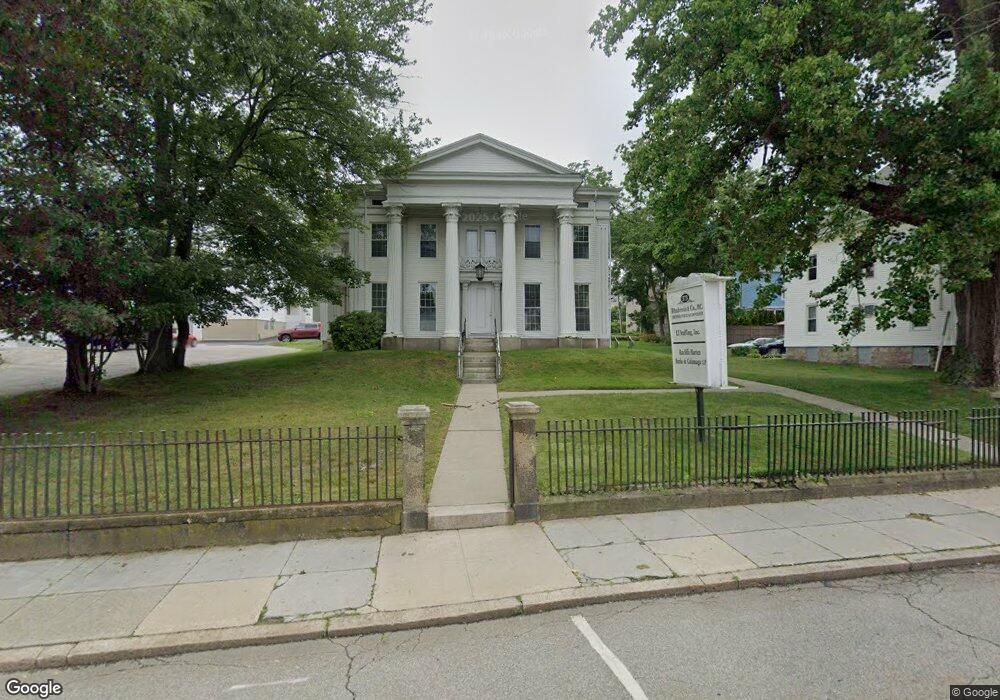
About This Home
This home is located at 373 N Main St, Fall River, MA 02720 and is currently estimated at $777,466, approximately $134 per square foot. 373 N Main St is a home located in Bristol County with nearby schools including Mary Fonseca Elementary School, Morton Middle School, and B M C Durfee High School.
Ownership History
We collect this data history from publicly available records. To have your information removed, we recommend requesting removal directly through your county’s website.
Purchase Details
Home Values in the Area
Average Home Value in this Area
Purchase History
We collect this data history from publicly available records. To have your information removed, we recommend requesting removal directly through your county’s website.
| Date | Buyer | Sale Price | Title Company |
|---|---|---|---|
| $400,000 | -- | ||
| $411,000 | -- |
Mortgage History
We collect this data history from publicly available records. To have your information removed, we recommend requesting removal directly through your county’s website.
| Date | Status | Borrower | Loan Amount |
|---|---|---|---|
| Open | $100,000 | ||
| Open | $300,000 | ||
| Closed | $100,000 |
Tax History
We collect this data history from publicly available records. To have your information removed, we recommend requesting removal directly through your county’s website.
| Year | Tax Paid | Tax Assessment Tax Assessment Total Assessment is a certain percentage of the fair market value that is determined by local assessors to be the total taxable value of land and additions on the property. | Land | Improvement |
|---|---|---|---|---|
| 2025 | $0 | $528,200 | $153,300 | $374,900 |
| 2024 | $11,834 | $494,300 | $146,000 | $348,300 |
| 2023 | $0 | $413,000 | $132,600 | $280,400 |
| 2022 | $0 | $413,000 | $132,600 | $280,400 |
| 2021 | $0 | $410,500 | $130,700 | $279,800 |
| 2020 | $0 | $409,600 | $136,700 | $272,900 |
| 2019 | $0 | $403,500 | $136,700 | $266,800 |
| 2018 | $0 | $398,900 | $136,700 | $262,200 |
| 2017 | $0 | $398,900 | $136,700 | $262,200 |
| 2016 | -- | $398,900 | $136,700 | $262,200 |
| 2015 | -- | $399,000 | $136,700 | $262,300 |
| 2014 | -- | $399,000 | $136,700 | $262,300 |
Map
- 333 Cherry St
- 362 High St
- 364 High St
- 485 Rock St
- 206 Durfee St Unit 2A
- 206 Durfee St Unit 2B
- 206 Durfee St Unit 3B
- 118 Maple St
- 556 High St
- 337 Danforth St Unit 7
- 339 Danforth St Unit 6
- 34 Danforth St
- 604 Rock St
- 0 Dexter St
- 216 Prospect St
- 540 Cherry St Unit 1
- 149 Franklin St
- 501 Pine St
- 613 Durfee St
- 199 Franklin St
- 94 June St
- 24 Gifford St
- 278 Locust St
- 268 Locust St
- 268 Locust St Unit 2
- 268 Locust St Unit 3
- 268 Locust St Unit 1
- 288 Locust St Unit 2 North
- 288 Locust St Unit 1
- 288 Locust St
- 254 Locust St
- 277 Walnut St
- 244 Locust St
- 95 June St
- 308 Locust St
- 308 Locust St Unit 3
- 308 Locust St Unit 2
- 111 June St Unit 2
- 111 June St
- 111 June St Unit 3S
Ask me questions while you tour the home.