375 Miles Patrick Rd Unit 1 Winder, GA 30680
Estimated Value: $291,000 - $310,000
About This Home
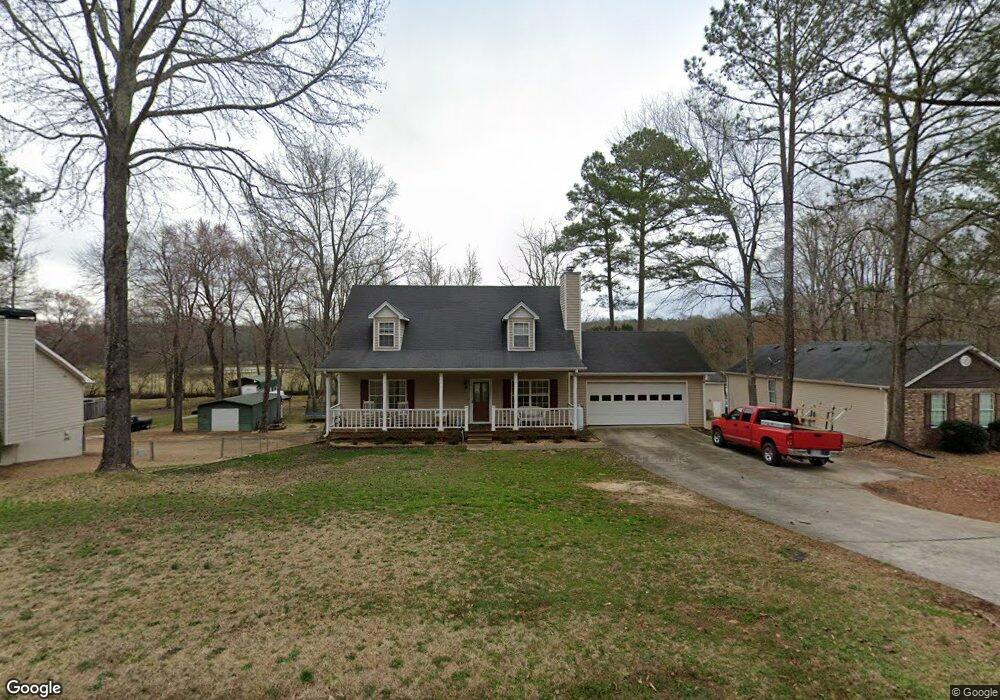
This home is located at 375 Miles Patrick Rd Unit 1, Winder, GA 30680 and is currently estimated at $300,526, approximately $231 per square foot. 375 Miles Patrick Rd Unit 1 is a home located in Barrow County with nearby schools including County Line Elementary School, Russell Middle School, and Winder-Barrow High School.
Ownership History
We collect this data history from publicly available records. To have your information removed, we recommend requesting removal directly through your county’s website.
Purchase Details
Home Financials for this Owner
Home Financials are based on the most recent Mortgage that was taken out on this home.Purchase Details
Home Financials for this Owner
Home Financials are based on the most recent Mortgage that was taken out on this home.Purchase Details
Purchase Details
Home Values in the Area
Average Home Value in this Area
Purchase History
We collect this data history from publicly available records. To have your information removed, we recommend requesting removal directly through your county’s website.
| Date | Buyer | Sale Price | Title Company |
|---|---|---|---|
| $121,600 | -- | ||
| $111,000 | -- | ||
| $10,000 | -- | ||
| $10,000 | -- |
Mortgage History
We collect this data history from publicly available records. To have your information removed, we recommend requesting removal directly through your county’s website.
| Date | Status | Borrower | Loan Amount |
|---|---|---|---|
| Open | $103,358 | ||
| Previous Owner | $105,450 |
Tax History
We collect this data history from publicly available records. To have your information removed, we recommend requesting removal directly through your county’s website.
| Year | Tax Paid | Tax Assessment Tax Assessment Total Assessment is a certain percentage of the fair market value that is determined by local assessors to be the total taxable value of land and additions on the property. | Land | Improvement |
|---|---|---|---|---|
| 2025 | $2,111 | $87,055 | $20,000 | $67,055 |
| 2024 | $2,116 | $85,362 | $20,000 | $65,362 |
| 2023 | $1,629 | $85,362 | $20,000 | $65,362 |
| 2022 | $2,202 | $72,157 | $18,000 | $54,157 |
| 2021 | $1,873 | $57,846 | $14,400 | $43,446 |
| 2020 | $1,740 | $54,275 | $14,400 | $39,875 |
| 2019 | $1,616 | $48,389 | $11,600 | $36,789 |
| 2018 | $1,609 | $48,389 | $11,600 | $36,789 |
| 2017 | $1,246 | $41,749 | $11,600 | $30,149 |
| 2016 | $1,289 | $42,114 | $11,600 | $30,514 |
| 2015 | $1,303 | $42,478 | $11,600 | $30,878 |
| 2014 | $1,146 | $38,468 | $6,860 | $31,608 |
| 2013 | -- | $36,976 | $6,860 | $30,116 |
Map
- 207 Buena Vista St
- 223 Lacey Ln
- 197 Buena Vista St
- 147 Langford St
- 353 Fall View Ct
- 150 Sims St
- 270 Cora Lou Ln
- 0 E Northcrest Dr Unit 10648147
- 236 Hidden Ct
- 326 Fayette Dr
- 223 N 5th Ave
- 469 Plantation Dr
- 234 N 5th Ave
- 2050 Whispering Way
- 307 6th Ave
- 136 Alexander Ct
- 882 Whispering Way
- 858 Pine Shadow Ln
- 846 Idlewood Rd
- 40 Oak Hill Dr
- 367 Miles Patrick Rd Unit 1
- 377 Miles Patrick Rd Unit 1
- 2.23 ACRES Miles Patrick Rd
- 379 Miles Patrick Rd Unit 1
- 363 Miles Patrick Rd
- 368 Miles Patrick Rd
- 362 Miles Patrick Rd
- 385 Miles Patrick Rd
- 378 Miles Patrick Rd
- 355 Miles Patrick Rd
- 382 Miles Patrick Rd
- 374 Miles Patrick Rd
- 386 Miles Patrick Rd
- 351 Miles Patrick Rd
- 390 Miles Patrick Rd Unit 1
- 391 Miles Patrick Rd Unit 1
- 352 Miles Patrick Rd
- 349 Miles Patrick Rd
- 394 Miles Patrick Rd Unit 1
- 345 Miles Patrick Rd
Ask me questions while you tour the home.