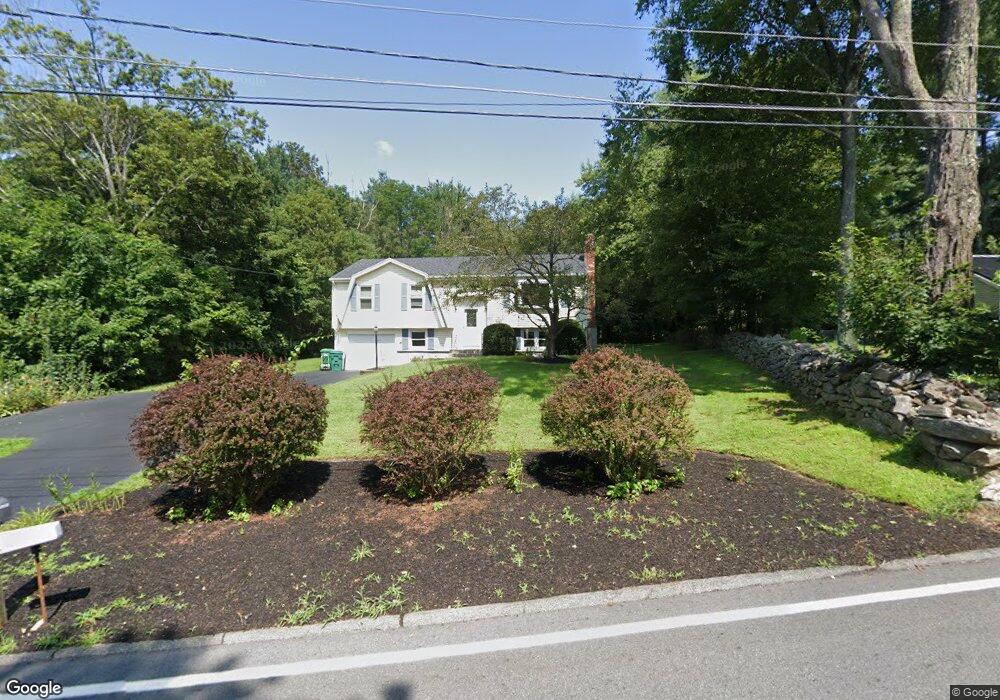
377 Benson Rd Northbridge, MA 01534
Estimated Value: $470,000 - $488,000
About This Home
This home is located at 377 Benson Rd, Northbridge, MA 01534 and is currently estimated at $481,993, approximately $307 per square foot. 377 Benson Rd is a home located in Worcester County with nearby schools including Northbridge Elementary School, Northbridge Middle School, and Northbridge High School.
Ownership History
We collect this data history from publicly available records. To have your information removed, we recommend requesting removal directly through your county’s website.
Purchase Details
Purchase Details
Home Values in the Area
Average Home Value in this Area
Purchase History
We collect this data history from publicly available records. To have your information removed, we recommend requesting removal directly through your county’s website.
| Date | Buyer | Sale Price | Title Company |
|---|---|---|---|
| -- | -- | ||
| -- | -- | ||
| -- | -- |
Mortgage History
We collect this data history from publicly available records. To have your information removed, we recommend requesting removal directly through your county’s website.
| Date | Status | Borrower | Loan Amount |
|---|---|---|---|
| Previous Owner | $10,000 | ||
| Previous Owner | $10,000 |
Tax History
We collect this data history from publicly available records. To have your information removed, we recommend requesting removal directly through your county’s website.
| Year | Tax Paid | Tax Assessment Tax Assessment Total Assessment is a certain percentage of the fair market value that is determined by local assessors to be the total taxable value of land and additions on the property. | Land | Improvement |
|---|---|---|---|---|
| 2025 | $4,549 | $385,800 | $159,900 | $225,900 |
| 2024 | $4,504 | $372,500 | $159,900 | $212,600 |
| 2023 | $4,669 | $360,300 | $159,900 | $200,400 |
| 2022 | $4,240 | $307,900 | $123,900 | $184,000 |
| 2021 | $4,143 | $285,900 | $118,100 | $167,800 |
| 2020 | $3,860 | $278,900 | $118,100 | $160,800 |
| 2019 | $3,503 | $270,100 | $118,100 | $152,000 |
| 2018 | $3,331 | $257,400 | $112,500 | $144,900 |
| 2017 | $3,339 | $246,800 | $112,500 | $134,300 |
| 2016 | $3,113 | $226,400 | $102,300 | $124,100 |
| 2015 | $3,029 | $226,400 | $102,300 | $124,100 |
| 2014 | $2,819 | $212,600 | $102,300 | $110,300 |
Map
- 90 Windstone Dr
- 50 Roy St
- 100 Delmar Dr
- 106 Sherry St
- 1617 Providence Rd
- 567-569 Hill St
- 150 Samuel Dr
- 45 Highland St
- 30 Gill Ct
- 579 Church St
- 608 Church St
- 111 Lea Ave
- 556 Church St
- 1076 Hill St
- 61 Hillview Ln
- 135 Rolling Ridge Dr Unit 56
- 0 S Main St
- 170 Stone Hill Dr Unit 170
- 162 Rolling Ridge Dr Unit 103
- 164 Rolling Ridge Dr Unit 102
- 365 Benson Rd
- 364 Benson Rd
- 391 Benson Rd
- 384 Benson Rd
- 401 Benson Rd
- 402 Benson Rd
- 403 Benson Rd
- 517 Highland St
- 318 Benson Rd
- 527 Highland St
- 549 Highland St
- 503 Highland St
- 595 Highland St
- 489 Highland St
- 11 Windstone Dr
- 579 Highland St
- 522 Highland St
- 334 Benson Rd
- 546 Highland St
- 17 Windstone Dr
Ask me questions while you tour the home.