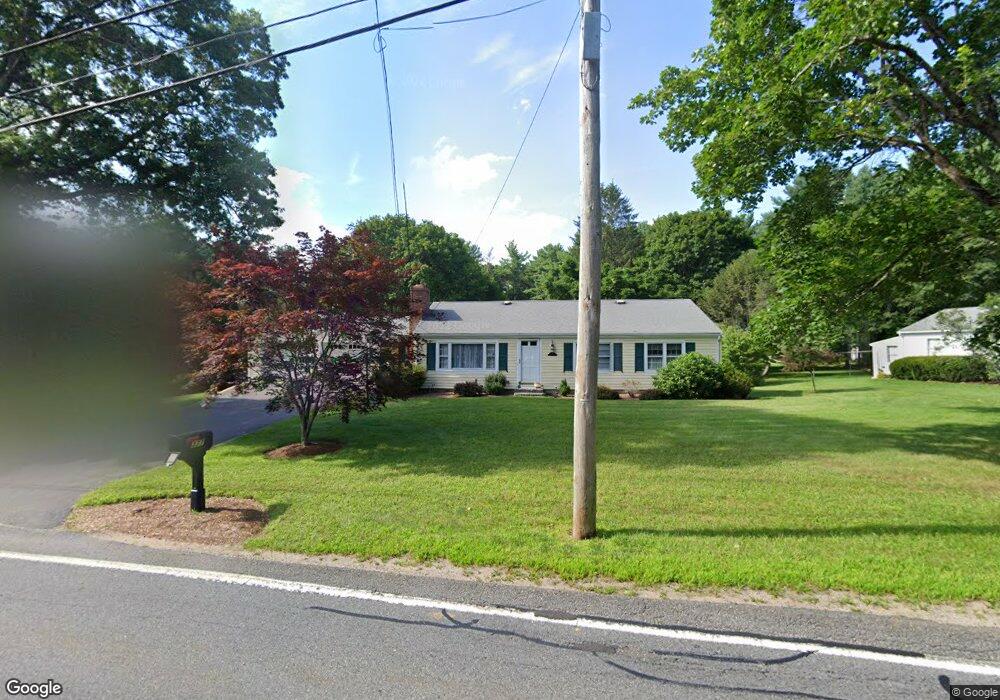
377 Oldham St Pembroke, MA 02359
Estimated Value: $616,261 - $635,000
About This Home
This home is located at 377 Oldham St, Pembroke, MA 02359 and is currently estimated at $627,815, approximately $467 per square foot. 377 Oldham St is a home located in Plymouth County with nearby schools including Pembroke High School.
Ownership History
We collect this data history from publicly available records. To have your information removed, we recommend requesting removal directly through your county’s website.
Purchase Details
Purchase Details
Purchase Details
Home Financials for this Owner
Home Financials are based on the most recent Mortgage that was taken out on this home.Purchase History
We collect this data history from publicly available records. To have your information removed, we recommend requesting removal directly through your county’s website.
| Date | Buyer | Sale Price | Title Company |
|---|---|---|---|
| -- | -- | ||
| $180,000 | -- | ||
| $150,000 | -- |
Mortgage History
We collect this data history from publicly available records. To have your information removed, we recommend requesting removal directly through your county’s website.
| Date | Status | Borrower | Loan Amount |
|---|---|---|---|
| Previous Owner | $150,000 | ||
| Previous Owner | $75,500 |
Tax History
We collect this data history from publicly available records. To have your information removed, we recommend requesting removal directly through your county’s website.
| Year | Tax Paid | Tax Assessment Tax Assessment Total Assessment is a certain percentage of the fair market value that is determined by local assessors to be the total taxable value of land and additions on the property. | Land | Improvement |
|---|---|---|---|---|
| 2025 | $6,179 | $514,100 | $306,800 | $207,300 |
| 2024 | $6,098 | $506,900 | $301,600 | $205,300 |
| 2023 | $5,957 | $468,300 | $276,800 | $191,500 |
| 2022 | $5,629 | $397,800 | $231,200 | $166,600 |
| 2021 | $5,281 | $362,200 | $221,200 | $141,000 |
| 2020 | $5,183 | $357,700 | $216,400 | $141,300 |
| 2019 | $4,949 | $339,000 | $206,300 | $132,700 |
| 2018 | $4,720 | $317,000 | $201,100 | $115,900 |
| 2017 | $4,636 | $307,000 | $191,100 | $115,900 |
| 2016 | $4,486 | $294,000 | $178,700 | $115,300 |
| 2015 | $4,222 | $286,400 | $171,100 | $115,300 |
Map
- 63 Pine Tree Ln
- 254 Lakeside Rd
- 258 State St
- 8 Joanne Dr
- 90 W Elm St
- 42 Taylor Point Rd
- 7 Elm Place
- 56 Wildwood Rd
- 243 Maquan St
- 113 Andrew Ln
- 58 Carriage Rd
- 77 Furnace Ln
- 29 Andrew Dr
- 161 Winter St Unit 2
- 31 Stonebridge Dr Unit 31
- 1148 Broadway
- 75 Center St
- 102 Ransom Rd
- 204 Center St Unit 9
- 93 Stonebridge Dr Unit 93
Ask me questions while you tour the home.