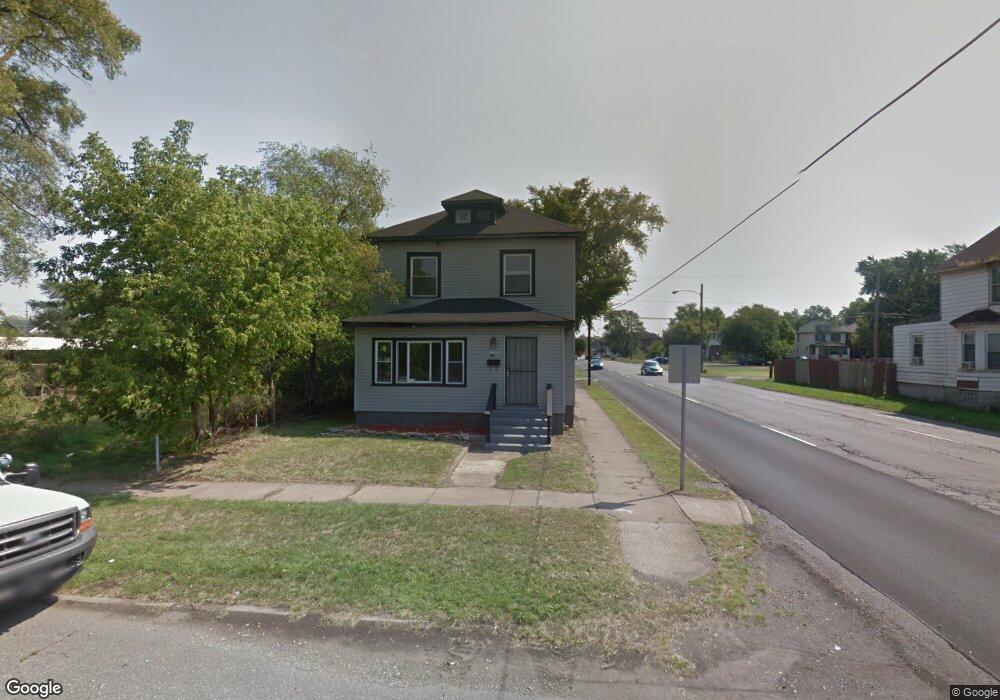
377 Tyler St Gary, IN 46402
Downtown Gary NeighborhoodEstimated Value: $49,000
4
Beds
2
Baths
2,131
Sq Ft
$23/Sq Ft
Est. Value
About This Home
This home is located at 377 Tyler St, Gary, IN 46402 and is currently priced at $49,000, approximately $22 per square foot. 377 Tyler St is a home located in Lake County with nearby schools including Beveridge Elementary School, Gary Middle School, and West Side Leadership Academy.
Ownership History
Date
Name
Owned For
Owner Type
Purchase Details
Closed on
May 13, 2019
Sold by
Menora Financial Corp
Bought by
Gary Home & Health Llc
Current Estimated Value
Home Financials for this Owner
Home Financials are based on the most recent Mortgage that was taken out on this home.
Original Mortgage
$8,046,000
Outstanding Balance
$7,015,270
Interest Rate
4.1%
Purchase Details
Closed on
Apr 11, 2014
Sold by
Menora Financial Corp
Bought by
Gary Home And Health Llc
Purchase Details
Closed on
Apr 4, 2014
Sold by
Another Source 4 Homes Llc
Bought by
Manora Financial Corp
Purchase Details
Closed on
Aug 20, 2010
Sold by
Howart Donna C
Bought by
Another Source 4 Homes Llc
Create a Home Valuation Report for This Property
The Home Valuation Report is an in-depth analysis detailing your home's value as well as a comparison with similar homes in the area
Home Values in the Area
Average Home Value in this Area
Purchase History
We collect this data history from publicly available records. To have your information removed, we recommend requesting removal directly through your county’s website.
| Date | Buyer | Sale Price | Title Company |
|---|---|---|---|
| Gary Home & Health Llc | -- | -- | |
| Gary Home And Health Llc | -- | Indiana Title Network Co | |
| Manora Financial Corp | -- | Indiana Title Network Co | |
| Another Source 4 Homes Llc | -- | Indiana Title Network Co |
Source: Public Records
Mortgage History
We collect this data history from publicly available records. To have your information removed, we recommend requesting removal directly through your county’s website.
| Date | Status | Borrower | Loan Amount |
|---|---|---|---|
| Open | Gary Home & Health Llc | $8,046,000 | |
| Closed | Gary Home & Health Llc | -- |
Source: Public Records
Tax History
| Year | Tax Paid | Tax Assessment Tax Assessment Total Assessment is a certain percentage of the fair market value that is determined by local assessors to be the total taxable value of land and additions on the property. | Land | Improvement |
|---|---|---|---|---|
| 2025 | $607 | $5,900 | $1,900 | $4,000 |
| 2024 | $467 | $5,200 | $1,900 | $3,300 |
| 2023 | $256 | $5,300 | $1,900 | $3,400 |
| 2022 | $256 | $7,200 | $1,900 | $5,300 |
| 2021 | $239 | $6,700 | $1,900 | $4,800 |
| 2020 | $239 | $6,700 | $1,900 | $4,800 |
| 2019 | $900 | $8,300 | $1,900 | $6,400 |
| 2018 | $1,074 | $13,900 | $7,500 | $6,400 |
| 2017 | $859 | $13,900 | $7,500 | $6,400 |
| 2016 | $1,011 | $44,600 | $3,700 | $40,900 |
| 2014 | $1,102 | $47,100 | $4,300 | $42,800 |
| 2013 | $1,031 | $45,900 | $4,300 | $41,600 |
Source: Public Records
Map
Nearby Homes
- 329 Pierce St
- 333 Jackson St
- 434 Pierce St
- 308 Pierce St
- 435 Buchanan St Unit 46402
- 565 Jackson St
- 361 Madison St
- 600 Pierce St
- 701 Tyler St
- 201 Johnson St
- 420 Adams St
- 747 Van Buren St
- 568 Johnson St
- 768 Tyler St
- 743 Buchanan St
- 733 Lincoln St
- 809 Pierce St
- 833 Fillmore St
- 805 Buchanan St
- 800 Buchanan St
Your Personal Tour Guide
Ask me questions while you tour the home.