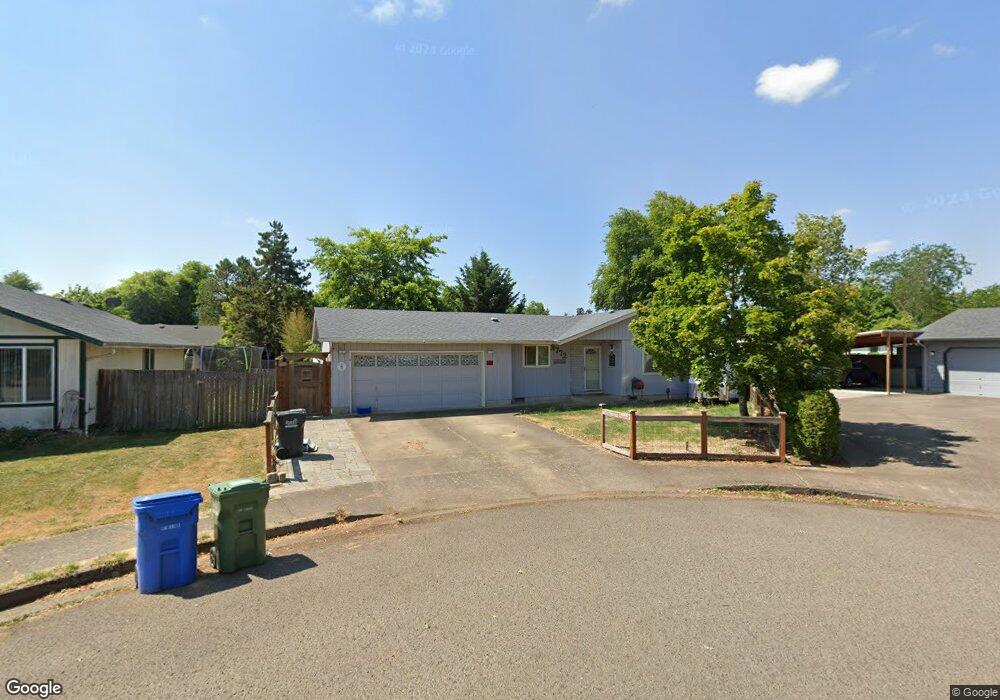
3772 Plumtree Dr Eugene, OR 97402
Churchill NeighborhoodEstimated Value: $370,000 - $381,000
3
Beds
2
Baths
1,086
Sq Ft
$346/Sq Ft
Est. Value
About This Home
This home is located at 3772 Plumtree Dr, Eugene, OR 97402 and is currently estimated at $375,418, approximately $345 per square foot. 3772 Plumtree Dr is a home located in Lane County with nearby schools including McCornack Elementary School, Kennedy Middle School, and Churchill High School.
Ownership History
Date
Name
Owned For
Owner Type
Purchase Details
Closed on
Apr 17, 2024
Sold by
Swendeman Sarah
Bought by
Russell Justin
Current Estimated Value
Purchase Details
Closed on
Oct 14, 2020
Sold by
Russell True
Bought by
Swendeman Sarah
Purchase Details
Closed on
Feb 14, 2014
Sold by
Fannie Mae
Bought by
Russell True
Purchase Details
Closed on
Jul 11, 2013
Sold by
Thessen Ericka C and Thessen Riley S
Bought by
Federal National Mortgage Association
Purchase Details
Closed on
Mar 7, 2002
Sold by
Sand Mathew D and Sand Sherri L
Bought by
Thessen Riley S and Thessen Ericka C
Home Financials for this Owner
Home Financials are based on the most recent Mortgage that was taken out on this home.
Original Mortgage
$119,130
Interest Rate
6.85%
Mortgage Type
FHA
Create a Home Valuation Report for This Property
The Home Valuation Report is an in-depth analysis detailing your home's value as well as a comparison with similar homes in the area
Home Values in the Area
Average Home Value in this Area
Purchase History
| Date | Buyer | Sale Price | Title Company |
|---|---|---|---|
| Russell Justin | -- | None Listed On Document | |
| Swendeman Sarah | -- | None Available | |
| Russell True | $165,000 | Nextitle | |
| Federal National Mortgage Association | $191,982 | None Available | |
| Thessen Riley S | $121,000 | Western Pioneer Title Co |
Source: Public Records
Mortgage History
| Date | Status | Borrower | Loan Amount |
|---|---|---|---|
| Previous Owner | Thessen Riley S | $119,130 |
Source: Public Records
Tax History
| Year | Tax Paid | Tax Assessment Tax Assessment Total Assessment is a certain percentage of the fair market value that is determined by local assessors to be the total taxable value of land and additions on the property. | Land | Improvement |
|---|---|---|---|---|
| 2025 | $3,710 | $190,426 | -- | -- |
| 2024 | $3,664 | $184,880 | -- | -- |
| 2023 | $3,664 | $179,496 | -- | -- |
| 2022 | $3,433 | $174,268 | $0 | $0 |
| 2021 | $3,224 | $169,193 | $0 | $0 |
| 2020 | $3,235 | $164,266 | $0 | $0 |
| 2019 | $3,125 | $159,482 | $0 | $0 |
| 2018 | $2,941 | $150,327 | $0 | $0 |
| 2017 | $2,791 | $150,327 | $0 | $0 |
| 2016 | $2,647 | $145,949 | $0 | $0 |
| 2015 | $2,533 | $141,698 | $0 | $0 |
| 2014 | $2,483 | $137,571 | $0 | $0 |
Source: Public Records
Map
Nearby Homes
- 3705 Peppertree Dr
- 3826 Peppertree Dr
- 1415 S Bertelsen Rd Unit 96
- 1415 S Bertelsen Rd Unit 34
- 1415 S Bertelsen Rd Unit 143
- 3958 Pam St
- 1925 Harvard Dr
- 1885 Churchill St
- 1625 S Bertelsen Rd
- 3534 Westleigh St
- 1980 Princeton Dr
- 1438 Quaker St
- 1326 Quaker St
- 1580 Brittany St
- 1365 Quaker St
- 3315 W 18th Ave
- 3823 Wilshire Ln
- 2953 W 15th Ave
- 1432 Fetters Loop
- 0 W 18th Ave Unit LOT 2
- 3788 Plumtree Dr
- 3760 Plumtree Dr
- 3782 Peppertree Dr
- 3784 Peppertree Dr
- 3780 Peppertree Dr
- 3758 Plumtree Dr
- 3789 Plumtree Dr
- 3778 Peppertree Dr
- 3786 Peppertree Dr
- 3775 Plumtree Dr
- 3763 Plumtree Dr
- 3746 Plumtree Dr
- 3776 Peppertree Dr
- 3751 Plumtree Dr
- 3788 Peppertree Dr
- 3783 Peppertree Dr
- 3781 Peppertree Dr
- 3785 Peppertree Dr
- 3734 Plumtree Dr
- 3779 Peppertree Dr
Your Personal Tour Guide
Ask me questions while you tour the home.