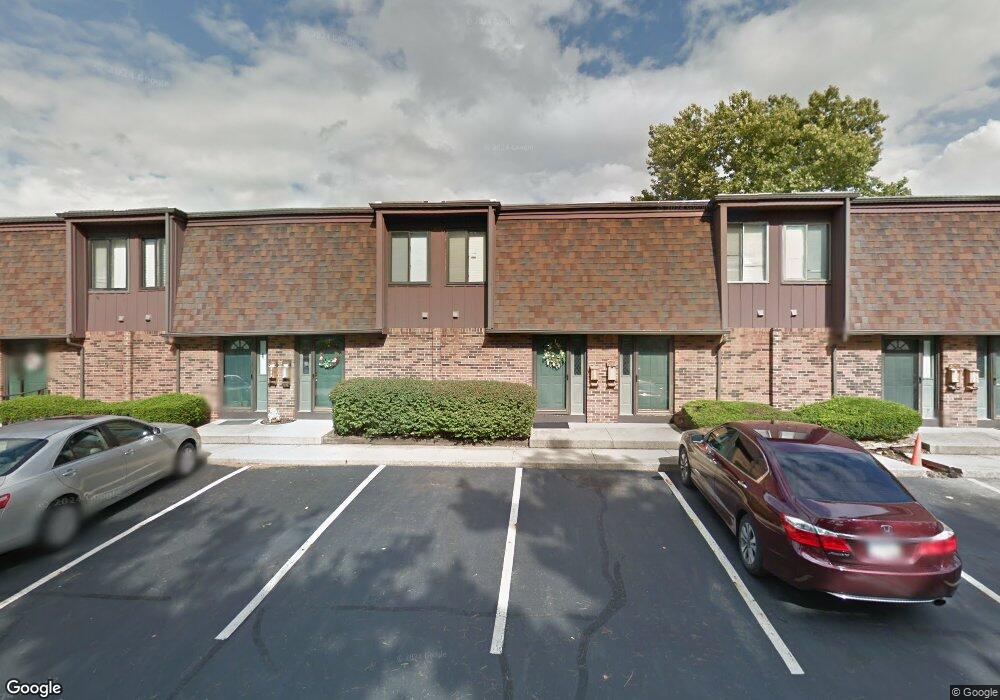
378 Shell Ct W Unit C378 Columbus, OH 43213
Estimated Value: $141,000 - $153,000
2
Beds
2
Baths
952
Sq Ft
$155/Sq Ft
Est. Value
About This Home
This home is located at 378 Shell Ct W Unit C378, Columbus, OH 43213 and is currently estimated at $147,385, approximately $154 per square foot. 378 Shell Ct W Unit C378 is a home located in Franklin County with nearby schools including Etna Road Elementary School, Beechwood Elementary School, and Rosemore Middle School.
Ownership History
Date
Name
Owned For
Owner Type
Purchase Details
Closed on
Oct 30, 2020
Sold by
Zukowski Teresa
Bought by
Kitaw Meaza S
Current Estimated Value
Home Financials for this Owner
Home Financials are based on the most recent Mortgage that was taken out on this home.
Original Mortgage
$52,000
Outstanding Balance
$45,848
Interest Rate
2.8%
Mortgage Type
New Conventional
Estimated Equity
$101,537
Purchase Details
Closed on
Jul 28, 2020
Sold by
Zukowski Teresa and Zukowski Andrew
Bought by
Zukowski Teresa
Purchase Details
Closed on
Jan 21, 2004
Sold by
Bankiewicz Michael C
Bought by
Zukowski Andrew and Zukowski Teresa
Purchase Details
Closed on
Apr 23, 1992
Bought by
Bankiewicz Michael C
Create a Home Valuation Report for This Property
The Home Valuation Report is an in-depth analysis detailing your home's value as well as a comparison with similar homes in the area
Home Values in the Area
Average Home Value in this Area
Purchase History
We collect this data history from publicly available records. To have your information removed, we recommend requesting removal directly through your county’s website.
| Date | Buyer | Sale Price | Title Company |
|---|---|---|---|
| Kitaw Meaza S | $65,000 | Crown Search Services Ltd | |
| Zukowski Teresa | -- | None Available | |
| Zukowski Andrew | $48,500 | -- | |
| Bankiewicz Michael C | $26,500 | -- |
Source: Public Records
Mortgage History
We collect this data history from publicly available records. To have your information removed, we recommend requesting removal directly through your county’s website.
| Date | Status | Borrower | Loan Amount |
|---|---|---|---|
| Open | Kitaw Meaza S | $52,000 |
Source: Public Records
Tax History
| Year | Tax Paid | Tax Assessment Tax Assessment Total Assessment is a certain percentage of the fair market value that is determined by local assessors to be the total taxable value of land and additions on the property. | Land | Improvement |
|---|---|---|---|---|
| 2025 | $1,209 | $27,660 | $5,780 | $21,880 |
| 2024 | $1,209 | $27,660 | $5,780 | $21,880 |
| 2023 | $1,201 | $27,650 | $5,775 | $21,875 |
| 2022 | $918 | $16,070 | $1,890 | $14,180 |
| 2021 | $862 | $16,070 | $1,890 | $14,180 |
| 2020 | $360 | $16,070 | $1,890 | $14,180 |
| 2019 | $192 | $11,900 | $1,400 | $10,500 |
| 2018 | $98 | $11,900 | $1,400 | $10,500 |
| 2017 | $186 | $11,900 | $1,400 | $10,500 |
| 2016 | $167 | $11,310 | $2,210 | $9,100 |
| 2015 | $84 | $11,310 | $2,210 | $9,100 |
| 2014 | $169 | $11,310 | $2,210 | $9,100 |
| 2013 | $143 | $13,300 | $2,590 | $10,710 |
Source: Public Records
Map
Nearby Homes
- 4892 Fairway Oaks Dr
- 4510 Broadhurst Dr
- 572 Westphal Ave
- 4623 Langley Ave
- 424 Wolfe Ave
- 4993 Dimson Dr N
- 792 Ross Rd
- 668 Erickson Ave
- 686 Fairway Blvd
- 5180 Etna Rd
- 714 Fairway Blvd
- 844 Westphal Ave
- 4117 Elbern Ave
- 746 S Yearling Rd
- 798 S Yearling Rd
- 800 S Yearling Rd
- 4308 E Main St Unit 1
- 1085 Shady Lane Rd
- 826 S Yearling Rd
- 231 Ironclad Dr
- 375 Shell Ct E Unit 375A
- 373 Shell Ct E
- 377 Shell Ct E Unit M377
- 371 Shell Ct E
- 381 Shell Ct E Unit M381
- 383 Shell Ct E
- 370 Shell Ct W Unit 370
- 376 Shell Ct W
- 385 Shell Ct E
- 372 Shell Ct W Unit 372
- 374 Shell Ct W
- 4771 Shell Ct N Unit O4771B
- 4777 Shell Ct N Unit O4777
- 4769 Shell Ct N Unit A4769
- 4773 Shell Ct N
- 4775 Shell Ct N Unit O4775
- 380 Shell Ct W Unit C380
- 382 Shell Ct W Unit C382
- 4767 Shell Ct N Unit 4767
- 389 Shell Ct E
Your Personal Tour Guide
Ask me questions while you tour the home.