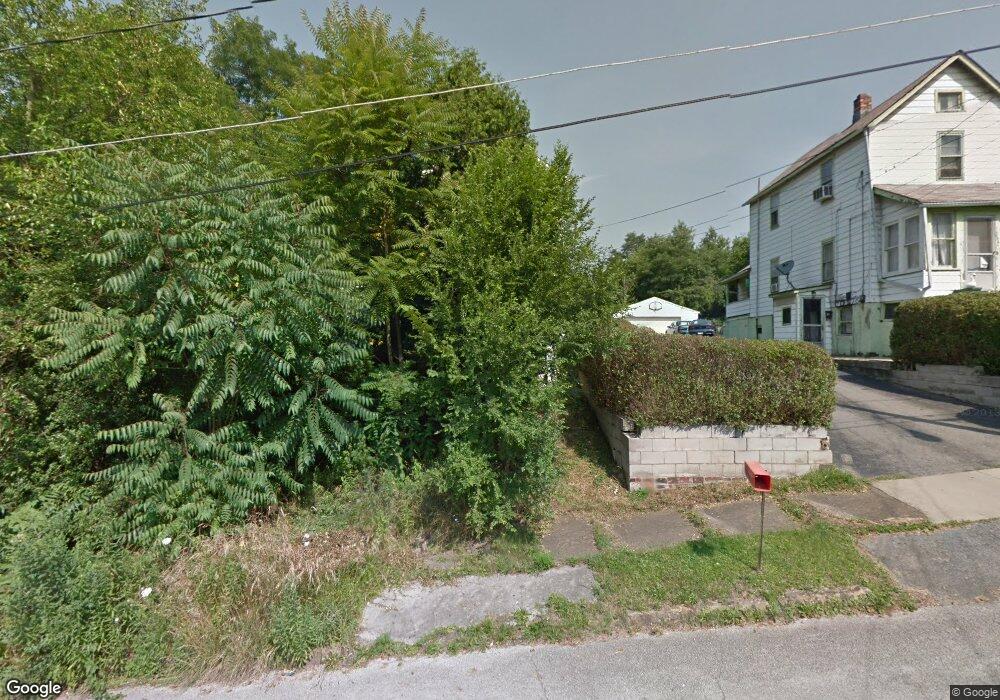
38 7th St Campbell, OH 44405
Estimated Value: $112,000
3
Beds
1
Bath
1,440
Sq Ft
$78/Sq Ft
Est. Value
About This Home
This home is located at 38 7th St, Campbell, OH 44405 and is currently estimated at $112,000, approximately $77 per square foot. 38 7th St is a home located in Mahoning County with nearby schools including Campbell Elementary School, Memorial High School, and Northeast Ohio Impact Academy.
Ownership History
Date
Name
Owned For
Owner Type
Purchase Details
Closed on
Mar 15, 2019
Sold by
Brown Frank and Yemma Daniel R
Bought by
Mahoning County Land Reutilization Corp
Current Estimated Value
Purchase Details
Closed on
Apr 26, 1995
Sold by
Hartman Craig E
Bought by
Marteeny Richard S and Marteeny Donna J
Home Financials for this Owner
Home Financials are based on the most recent Mortgage that was taken out on this home.
Original Mortgage
$43,916
Interest Rate
8.42%
Mortgage Type
FHA
Purchase Details
Closed on
Jun 30, 1989
Bought by
Brown Donna M
Create a Home Valuation Report for This Property
The Home Valuation Report is an in-depth analysis detailing your home's value as well as a comparison with similar homes in the area
Home Values in the Area
Average Home Value in this Area
Purchase History
| Date | Buyer | Sale Price | Title Company |
|---|---|---|---|
| Mahoning County Land Reutilization Corp | -- | None Available | |
| Marteeny Richard S | $43,500 | -- | |
| Brown Donna M | -- | -- |
Source: Public Records
Mortgage History
| Date | Status | Borrower | Loan Amount |
|---|---|---|---|
| Previous Owner | Marteeny Richard S | $43,916 |
Source: Public Records
Tax History
| Year | Tax Paid | Tax Assessment Tax Assessment Total Assessment is a certain percentage of the fair market value that is determined by local assessors to be the total taxable value of land and additions on the property. | Land | Improvement |
|---|---|---|---|---|
| 2025 | -- | $190 | $190 | -- |
| 2024 | -- | $190 | $190 | -- |
| 2022 | $0 | $190 | $190 | $0 |
| 2021 | $138 | $190 | $190 | $0 |
| 2020 | $138 | $190 | $190 | $0 |
| 2019 | $138 | $190 | $190 | $0 |
| 2018 | $168 | $2,070 | $370 | $1,700 |
| 2017 | $142 | $2,070 | $370 | $1,700 |
| 2016 | $142 | $2,190 | $370 | $1,820 |
| 2015 | $146 | $2,190 | $370 | $1,820 |
| 2014 | $139 | $2,190 | $370 | $1,820 |
| 2013 | $136 | $2,190 | $370 | $1,820 |
Source: Public Records
Map
Nearby Homes
- 190 10th St
- 114 Penhale Ave
- 130 12th St
- 374 Tenney Ave
- 459 Tenney Ave
- 330 Sanderson Ave
- 412 Whipple Ave
- 0 Penhale Ave
- 279 Coitsville Rd
- 204 Tremble Ave
- 377 Coitsville Rd
- 3563 Valerie Dr
- 3516 Champlain Ave
- 664 Tenney Ave
- 127 Blackburn St
- 214 Hamrock Dr
- 3443 Belden Ave
- 151 Regent St
- 103 Gladstone St
- 687 Moore Ave
Your Personal Tour Guide
Ask me questions while you tour the home.