T
Landlord's Agent in 2025
Tina DiMonda
Gibson Sothebys International Realty
(617) 936-4194
3 in this area
24 Total Sales


Estimated Value: $590,842 - $657,000
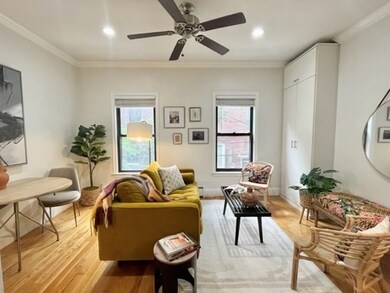
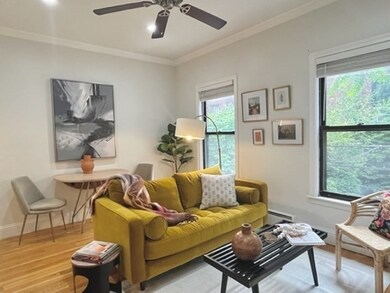
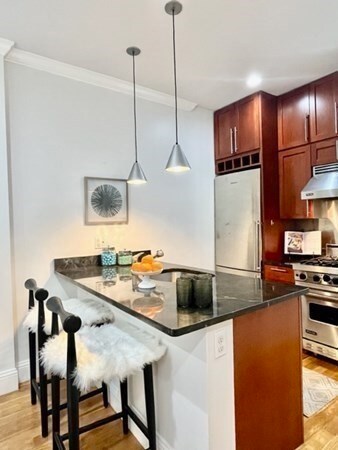
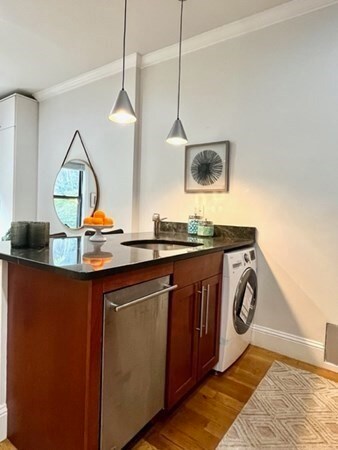
Charming 1 bed/1 bath apartment available in an A+ South End location. This floor-through home features high-end finishes, gorgeous crown molding, laundry in-unit & wonderful natural light. There is an updated, modern bathroom & lovely bedroom, able to fit a king-sized bed. Some clever built-in storage can also be found throughout. You'll live minutes from some of Boston's best shopping, parks, coffee + restaurants! Landlord prefers a shorter-term lease to get back on 9/1 cycle with an option to renew if tenant desires.
Last Agent to Rent the Property
Gibson Sotheby's International Realty Listed on: 01/09/2025

Co-Listed By
Shannon Kurban
Gibson Sotheby's International Realty
| Date | Buyer | Sale Price | Title Company |
|---|---|---|---|
| Josephine Kenny T | -- | None Available | |
| Weener Derek | $352,500 | -- |
| Date | Event | Price | List to Sale | Price per Sq Ft | Prior Sale |
|---|---|---|---|---|---|
| 03/14/2025 03/14/25 | Rented | $3,500 | +2.9% | -- | |
| 03/11/2025 03/11/25 | Under Contract | -- | -- | -- | |
| 01/09/2025 01/09/25 | For Rent | $3,400 | +6.3% | -- | |
| 02/05/2024 02/05/24 | Rented | $3,200 | +6.7% | -- | |
| 02/02/2024 02/02/24 | Under Contract | -- | -- | -- | |
| 01/29/2024 01/29/24 | For Rent | $3,000 | 0.0% | -- | |
| 07/07/2023 07/07/23 | Sold | $609,000 | 0.0% | $1,301 / Sq Ft | View Prior Sale |
| 06/12/2023 06/12/23 | Pending | -- | -- | -- | |
| 06/08/2023 06/08/23 | For Sale | $609,000 | 0.0% | $1,301 / Sq Ft | |
| 04/05/2021 04/05/21 | Rented | $2,400 | 0.0% | -- | |
| 03/18/2021 03/18/21 | For Rent | $2,400 | +14.3% | -- | |
| 03/18/2021 03/18/21 | Rented | $2,100 | 0.0% | -- | |
| 02/11/2021 02/11/21 | Price Changed | $2,100 | -8.7% | $4 / Sq Ft | |
| 01/27/2021 01/27/21 | For Rent | $2,300 | -3.2% | -- | |
| 12/10/2014 12/10/14 | Rented | $2,375 | -1.0% | -- | |
| 12/10/2014 12/10/14 | For Rent | $2,400 | 0.0% | -- | |
| 06/04/2014 06/04/14 | Sold | $539,000 | 0.0% | $963 / Sq Ft | View Prior Sale |
| 05/29/2014 05/29/14 | Pending | -- | -- | -- | |
| 04/29/2014 04/29/14 | Off Market | $539,000 | -- | -- | |
| 04/24/2014 04/24/14 | For Sale | $499,000 | -58.5% | $891 / Sq Ft | |
| 01/07/2013 01/07/13 | Sold | $1,201,000 | +2.2% | $888 / Sq Ft | View Prior Sale |
| 11/11/2012 11/11/12 | Pending | -- | -- | -- | |
| 10/31/2012 10/31/12 | For Sale | $1,175,000 | -- | $868 / Sq Ft |
| Year | Tax Paid | Tax Assessment Tax Assessment Total Assessment is a certain percentage of the fair market value that is determined by local assessors to be the total taxable value of land and additions on the property. | Land | Improvement |
|---|---|---|---|---|
| 2025 | $6,811 | $588,200 | $0 | $588,200 |
| 2024 | $6,166 | $565,700 | $0 | $565,700 |
| 2023 | $5,896 | $549,000 | $0 | $549,000 |
| 2022 | $5,688 | $522,800 | $0 | $522,800 |
| 2021 | $5,578 | $522,800 | $0 | $522,800 |
| 2020 | $5,041 | $477,400 | $0 | $477,400 |
| 2019 | $4,885 | $463,500 | $0 | $463,500 |
| 2018 | $4,583 | $437,300 | $0 | $437,300 |
| 2017 | $4,370 | $412,700 | $0 | $412,700 |
| 2016 | $4,365 | $396,800 | $0 | $396,800 |
| 2015 | $4,471 | $369,200 | $0 | $369,200 |
| 2014 | $3,910 | $310,800 | $0 | $310,800 |
T
Landlord's Agent in 2025
Tina DiMonda
Gibson Sothebys International Realty
(617) 936-4194
3 in this area
24 Total Sales
S
Landlord's Co-Listing Agent in 2025
Shannon Kurban
Gibson Sothebys International Realty
Seller's Agent in 2023
Arthur Deych
Block Realty
(617) 869-4907
1 in this area
147 Total Sales
D
Buyer's Agent in 2023
DiMonda Silk Team
Engel & Volkers Boston
1 in this area
15 Total Sales
Seller's Agent in 2021
Isabelle Rosenblatt
Red Tree Real Estate
(617) 833-1812
14 Total Sales
T
Buyer's Agent in 2021
The Haddad Homes Group
Compass
(617) 206-3333
1 in this area
26 Total Sales
Source: MLS Property Information Network (MLS PIN)
MLS Number: 73324594
APN: CBOS-000000-000005-000901-000014
Disclaimer: Certain information contained herein is derived from information provided by parties other than Homes.com. All information provided is deemed reliable, but is not guaranteed to be accurate and should be independently verified.
![]() The property listing data and information, or the Images, set forth herein were provided to MLS Property Information Network, Inc. from third party sources, including sellers, lessors and public records, and were compiled by MLS Property Information Network, Inc. The property listing data and information, and the Images, are for the personal, non-commercial use of consumers having a good faith interest in purchasing or leasing listed properties of the type displayed to them and may not be used for any purpose other than to identify prospective properties which such consumers may have a good faith interest in purchasing or leasing. MLS Property Information Network, Inc. and its subscribers disclaim any and all representations and warranties as to the accuracy of the property listing data and information, or as to the accuracy of any of the Images, set forth herein.
The property listing data and information, or the Images, set forth herein were provided to MLS Property Information Network, Inc. from third party sources, including sellers, lessors and public records, and were compiled by MLS Property Information Network, Inc. The property listing data and information, and the Images, are for the personal, non-commercial use of consumers having a good faith interest in purchasing or leasing listed properties of the type displayed to them and may not be used for any purpose other than to identify prospective properties which such consumers may have a good faith interest in purchasing or leasing. MLS Property Information Network, Inc. and its subscribers disclaim any and all representations and warranties as to the accuracy of the property listing data and information, or as to the accuracy of any of the Images, set forth herein.
Ask me questions while you tour the home.