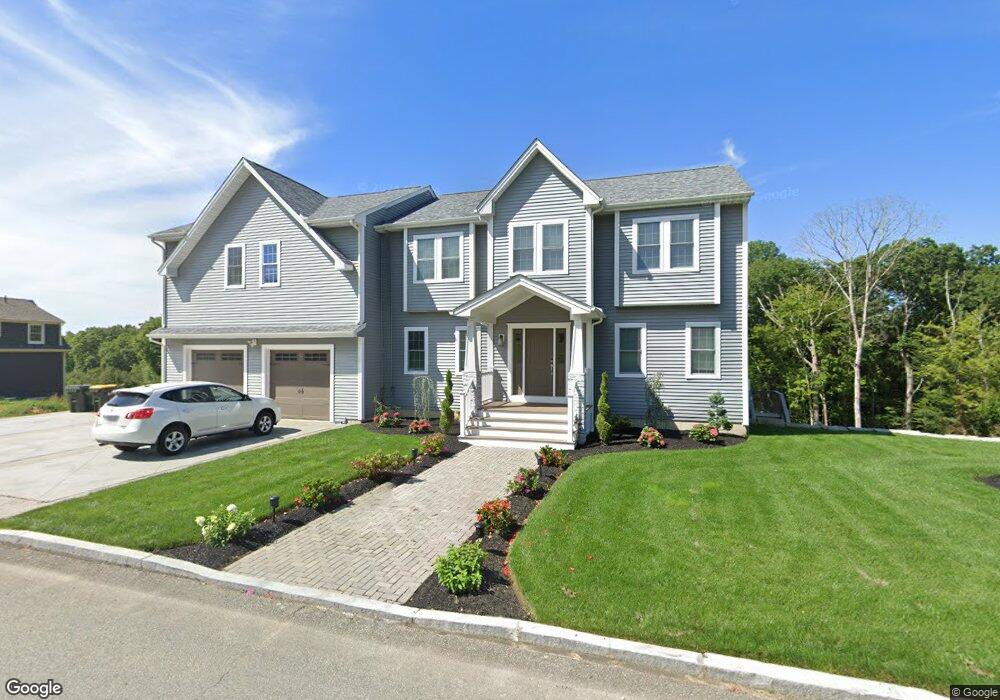
38 Bentley Ln Westport, MA 02790
Estimated Value: $936,587 - $1,115,000
3
Beds
3
Baths
3,068
Sq Ft
$330/Sq Ft
Est. Value
About This Home
This home is located at 38 Bentley Ln, Westport, MA 02790 and is currently estimated at $1,011,897, approximately $329 per square foot. 38 Bentley Ln is a home with nearby schools including Alice A. Macomber Primary School, Westport Elementary School, and Westport Middle-High School.
Ownership History
Date
Name
Owned For
Owner Type
Purchase Details
Closed on
Feb 28, 2020
Sold by
Rgk Rt
Bought by
Novo Joao F and Novo Tania A
Current Estimated Value
Home Financials for this Owner
Home Financials are based on the most recent Mortgage that was taken out on this home.
Original Mortgage
$412,800
Outstanding Balance
$362,370
Interest Rate
3.6%
Mortgage Type
New Conventional
Estimated Equity
$649,527
Create a Home Valuation Report for This Property
The Home Valuation Report is an in-depth analysis detailing your home's value as well as a comparison with similar homes in the area
Home Values in the Area
Average Home Value in this Area
Purchase History
We collect this data history from publicly available records. To have your information removed, we recommend requesting removal directly through your county’s website.
| Date | Buyer | Sale Price | Title Company |
|---|---|---|---|
| Novo Joao F | $516,000 | None Available |
Source: Public Records
Mortgage History
We collect this data history from publicly available records. To have your information removed, we recommend requesting removal directly through your county’s website.
| Date | Status | Borrower | Loan Amount |
|---|---|---|---|
| Open | Novo Joao F | $412,800 |
Source: Public Records
Tax History
| Year | Tax Paid | Tax Assessment Tax Assessment Total Assessment is a certain percentage of the fair market value that is determined by local assessors to be the total taxable value of land and additions on the property. | Land | Improvement |
|---|---|---|---|---|
| 2025 | $5,865 | $787,200 | $283,100 | $504,100 |
| 2024 | $5,671 | $733,600 | $267,600 | $466,000 |
| 2023 | $5,324 | $652,400 | $258,300 | $394,100 |
| 2022 | $5,203 | $613,600 | $258,300 | $355,300 |
| 2021 | $5,290 | $613,700 | $241,500 | $372,200 |
| 2020 | $1,979 | $234,700 | $234,700 | $0 |
| 2019 | $1,941 | $234,700 | $234,700 | $0 |
| 2018 | $1,915 | $234,400 | $234,400 | $0 |
| 2017 | $1,868 | $234,400 | $234,400 | $0 |
| 2016 | $1,854 | $234,400 | $234,400 | $0 |
| 2015 | $1,859 | $234,400 | $234,400 | $0 |
Source: Public Records
Map
Nearby Homes
- 3 Diane Way
- 5 Rock St
- 1163 Old Fall River Rd
- 16 Lenox Ave
- 565 Highland Ave
- 343 Old Bedford Rd
- 320-322 Old Bedford Rd
- 127 Gifford Rd
- 32 Madison Ct
- 0 Hertitage Acres
- 222 Blossom Rd
- 100 D Dr
- 350 Gifford Rd
- 47 Center St
- 6 Beaulieu St
- 21 Evergreen St
- 26 James Ave
- 50 Benoit St
- Lot 16-18 Old Fall River Rd
- 1148 American Legion Hwy
Your Personal Tour Guide
Ask me questions while you tour the home.