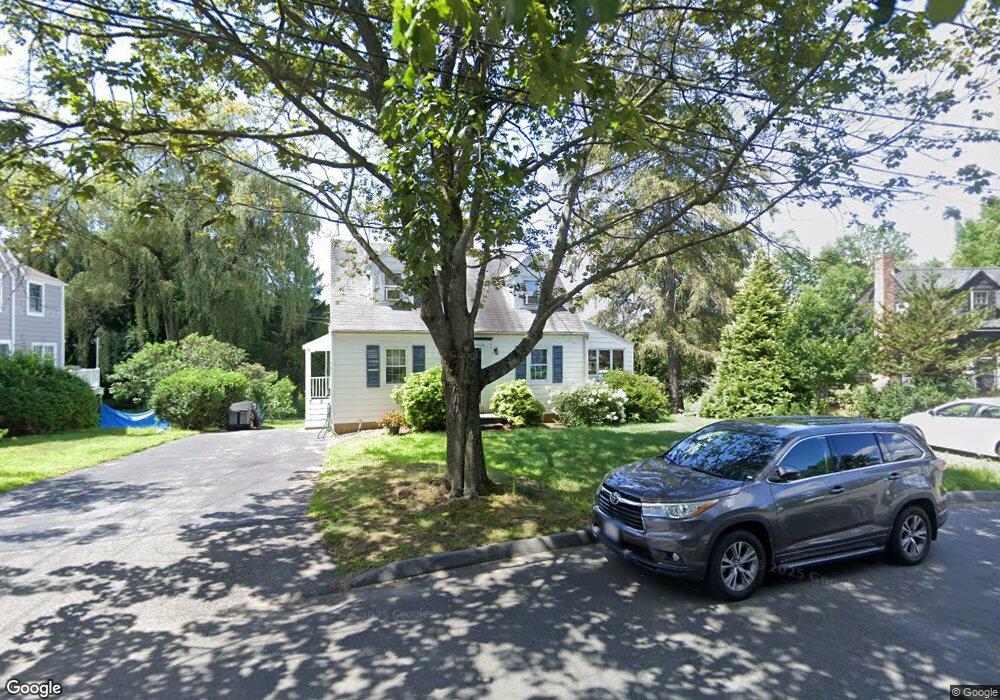
38 Bond St Reading, MA 01867
Estimated Value: $707,368 - $775,000
2
Beds
1
Bath
1,507
Sq Ft
$492/Sq Ft
Est. Value
About This Home
This home is located at 38 Bond St, Reading, MA 01867 and is currently estimated at $741,092, approximately $491 per square foot. 38 Bond St is a home located in Middlesex County with nearby schools including Alice M. Barrows Elementary School, Walter S. Parker Middle School, and Reading Memorial High School.
Ownership History
Date
Name
Owned For
Owner Type
Purchase Details
Closed on
Dec 18, 2020
Sold by
Kyle James B and Kyle Olive A
Bought by
Kyle James B
Current Estimated Value
Purchase Details
Closed on
Dec 16, 2008
Sold by
Kyle James B and Kyle Olive
Bought by
Kyle Ft and Kyle
Create a Home Valuation Report for This Property
The Home Valuation Report is an in-depth analysis detailing your home's value as well as a comparison with similar homes in the area
Home Values in the Area
Average Home Value in this Area
Purchase History
| Date | Buyer | Sale Price | Title Company |
|---|---|---|---|
| Kyle James B | -- | None Available | |
| Kyle James B | -- | None Available | |
| Kyle Ft | -- | -- |
Source: Public Records
Tax History
| Year | Tax Paid | Tax Assessment Tax Assessment Total Assessment is a certain percentage of the fair market value that is determined by local assessors to be the total taxable value of land and additions on the property. | Land | Improvement |
|---|---|---|---|---|
| 2025 | $7,434 | $652,700 | $439,400 | $213,300 |
| 2024 | $7,521 | $641,700 | $432,000 | $209,700 |
| 2023 | $7,612 | $604,600 | $407,000 | $197,600 |
| 2022 | $7,375 | $553,300 | $372,400 | $180,900 |
| 2021 | $6,719 | $486,500 | $321,100 | $165,400 |
| 2020 | $6,569 | $470,900 | $310,800 | $160,100 |
| 2019 | $6,281 | $441,400 | $291,300 | $150,100 |
| 2018 | $5,830 | $420,300 | $277,400 | $142,900 |
| 2017 | $5,505 | $392,400 | $259,000 | $133,400 |
| 2016 | $5,659 | $390,300 | $259,900 | $130,400 |
| 2015 | $5,463 | $371,600 | $247,500 | $124,100 |
| 2014 | $5,096 | $345,700 | $230,200 | $115,500 |
Source: Public Records
Map
Nearby Homes
- 89 Grand St
- 34 Plymouth Rd
- 64 Longfellow Rd
- 35 Longfellow Rd
- 430 West St
- 45 Longview Rd
- 5 Washington St Unit D4
- 101 King St Unit 101
- 319 West St
- 150 Grove St
- 37 Fremont St
- 17 Courtyard Place Unit 17
- 52 Sanborn St Unit 7
- 863 Main St
- 20 White Oaks Ln
- 141 Johnson Woods Dr
- 30 Taylor Dr Unit 3011
- 51 Winslow Rd
- 100 Prescott St
- 16 Munroe Ave
Your Personal Tour Guide
Ask me questions while you tour the home.