38 Capron St Uxbridge, MA 01569
Estimated Value: $619,888 - $709,000
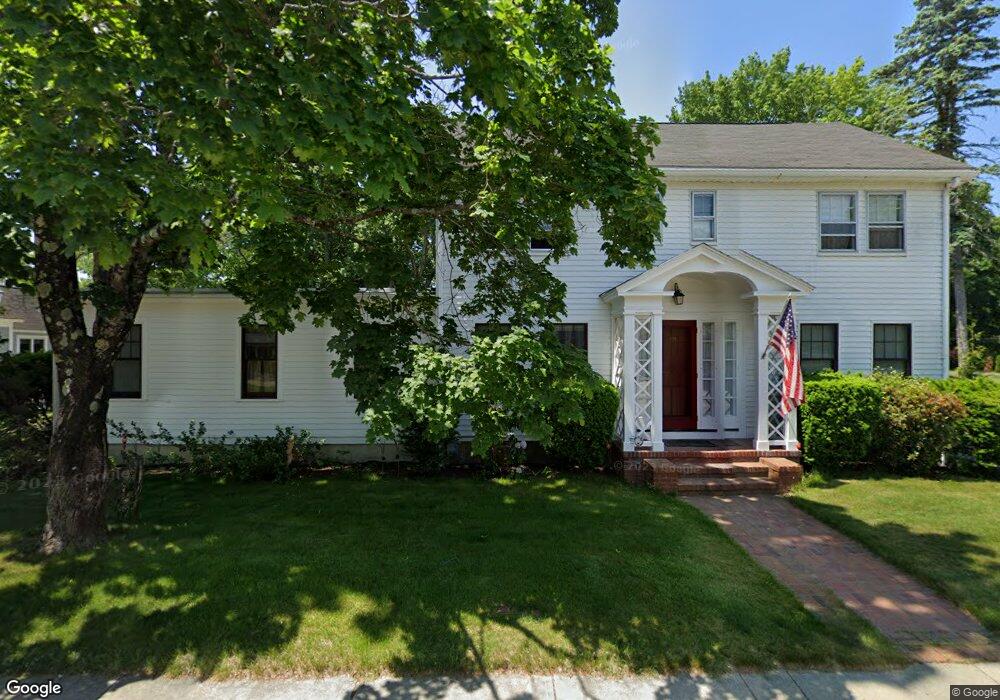
About This Home
This home is located at 38 Capron St, Uxbridge, MA 01569 and is currently estimated at $659,222, approximately $255 per square foot. 38 Capron St is a home located in Worcester County with nearby schools including Uxbridge High School, Our Lady of the Valley Regional School, and Whitinsville Christian School.
Ownership History
We collect this data history from publicly available records. To have your information removed, we recommend requesting removal directly through your county’s website.
Purchase Details
Purchase Details
Home Values in the Area
Average Home Value in this Area
Purchase History
We collect this data history from publicly available records. To have your information removed, we recommend requesting removal directly through your county’s website.
| Date | Buyer | Sale Price | Title Company |
|---|---|---|---|
| -- | None Available | ||
| $20,000 | -- |
Mortgage History
We collect this data history from publicly available records. To have your information removed, we recommend requesting removal directly through your county’s website.
| Date | Status | Borrower | Loan Amount |
|---|---|---|---|
| Previous Owner | $92,000 | ||
| Previous Owner | $65,000 | ||
| Previous Owner | $43,000 |
Tax History
We collect this data history from publicly available records. To have your information removed, we recommend requesting removal directly through your county’s website.
| Year | Tax Paid | Tax Assessment Tax Assessment Total Assessment is a certain percentage of the fair market value that is determined by local assessors to be the total taxable value of land and additions on the property. | Land | Improvement |
|---|---|---|---|---|
| 2025 | $66 | $501,700 | $153,200 | $348,500 |
| 2024 | $6,105 | $472,500 | $145,400 | $327,100 |
| 2023 | $6,019 | $431,500 | $125,700 | $305,800 |
| 2022 | $5,688 | $375,200 | $110,000 | $265,200 |
| 2021 | $5,936 | $375,200 | $110,000 | $265,200 |
| 2020 | $6,140 | $366,800 | $111,600 | $255,200 |
| 2019 | $6,366 | $366,900 | $122,700 | $244,200 |
| 2018 | $6,200 | $361,100 | $122,700 | $238,400 |
| 2017 | $6,828 | $402,600 | $116,600 | $286,000 |
| 2016 | $6,002 | $341,600 | $85,600 | $256,000 |
| 2015 | $5,864 | $337,000 | $85,600 | $251,400 |
Map
- 18 Pulaski St
- 19 Granite St
- 14 Seagrave St Unit 14
- 56 Nature View Dr
- 1 Carpenter Terrace
- 10 Pinecrest Rd
- 12 Pinecrest Rd Unit B
- 24 Road Ahr
- 27 Charles Ave
- 20 Pinecrest Rd Unit 20 b
- 152 S Main St
- 60 Rogerson Crossing Unit 60
- 113 Hazel St
- 27 Pouts Ln Unit 27
- 2 Strathmore Shire Dr Unit A
- 23 Yale St Unit 23
- 11 Boston St
- 101 Hunter Rd
- 115 Hunter Rd
- 21 William Ward St
Ask me questions while you tour the home.