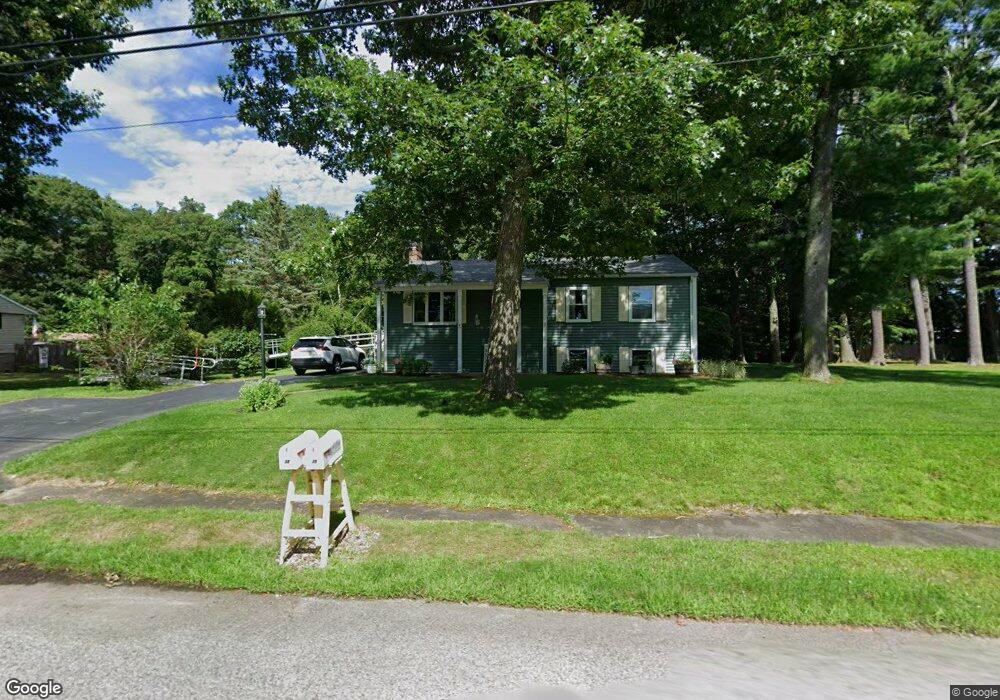
38 Chandler Dr Marshfield, MA 02050
Estimated Value: $711,026 - $767,000
3
Beds
3
Baths
1,306
Sq Ft
$571/Sq Ft
Est. Value
About This Home
This home is located at 38 Chandler Dr, Marshfield, MA 02050 and is currently estimated at $746,007, approximately $571 per square foot. 38 Chandler Dr is a home located in Plymouth County with nearby schools including Daniel Webster, Furnace Brook Middle School, and Marshfield High School.
Ownership History
Date
Name
Owned For
Owner Type
Purchase Details
Closed on
Feb 15, 2018
Sold by
Macdonald Ft 2 2018
Bought by
Macdonald Ft 2018
Current Estimated Value
Purchase Details
Closed on
Nov 17, 2006
Sold by
Macdonald Daavid J and Diane Macdonald F
Bought by
Macdonald Ft and Macdonald David J
Create a Home Valuation Report for This Property
The Home Valuation Report is an in-depth analysis detailing your home's value as well as a comparison with similar homes in the area
Home Values in the Area
Average Home Value in this Area
Purchase History
| Date | Buyer | Sale Price | Title Company |
|---|---|---|---|
| Macdonald Ft 2018 | -- | -- | |
| Macdonald Ft | -- | -- |
Source: Public Records
Mortgage History
| Date | Status | Borrower | Loan Amount |
|---|---|---|---|
| Previous Owner | Macdonald Ft | $50,000 | |
| Previous Owner | Macdonald Ft | $28,950 | |
| Previous Owner | Macdonald Ft | $10,000 | |
| Previous Owner | Macdonald Ft | $50,000 |
Source: Public Records
Tax History
| Year | Tax Paid | Tax Assessment Tax Assessment Total Assessment is a certain percentage of the fair market value that is determined by local assessors to be the total taxable value of land and additions on the property. | Land | Improvement |
|---|---|---|---|---|
| 2025 | $6,223 | $628,600 | $303,800 | $324,800 |
| 2024 | $6,067 | $583,900 | $289,300 | $294,600 |
| 2023 | $5,453 | $512,000 | $258,300 | $253,700 |
| 2022 | $5,453 | $421,100 | $217,000 | $204,100 |
| 2021 | $5,223 | $396,000 | $217,000 | $179,000 |
| 2020 | $4,956 | $371,800 | $196,300 | $175,500 |
| 2019 | $4,857 | $363,000 | $196,300 | $166,700 |
| 2018 | $4,736 | $354,200 | $196,300 | $157,900 |
| 2017 | $4,591 | $334,600 | $196,300 | $138,300 |
| 2016 | $4,547 | $327,600 | $196,300 | $131,300 |
| 2015 | $4,354 | $327,600 | $196,300 | $131,300 |
| 2014 | $4,097 | $308,300 | $196,300 | $112,000 |
Source: Public Records
Map
Nearby Homes
- 13 Harlow Rd
- 42 Carr Rd
- 1221 Ocean St
- 134 Wellington Ave
- 155 Quincy Ave
- 136 Revere St
- 91 Winslow St
- 4 Fresh Brook Waye
- 713 Webster St
- 52 Parkway
- 130 Winslow Cemetery Rd
- 555 Webster St
- 6 Maple Ln
- 95 Blackmount Dr
- 25 11th Rd
- 23 Johnson Terrace
- 51 Meetinghouse Ln
- 10 Spyglass Landing Dr
- 412 Moraine St
- 152 Acorn St
Your Personal Tour Guide
Ask me questions while you tour the home.