38 Charles Rd Harwich, MA 02645
East Harwich NeighborhoodEstimated Value: $611,000 - $752,744
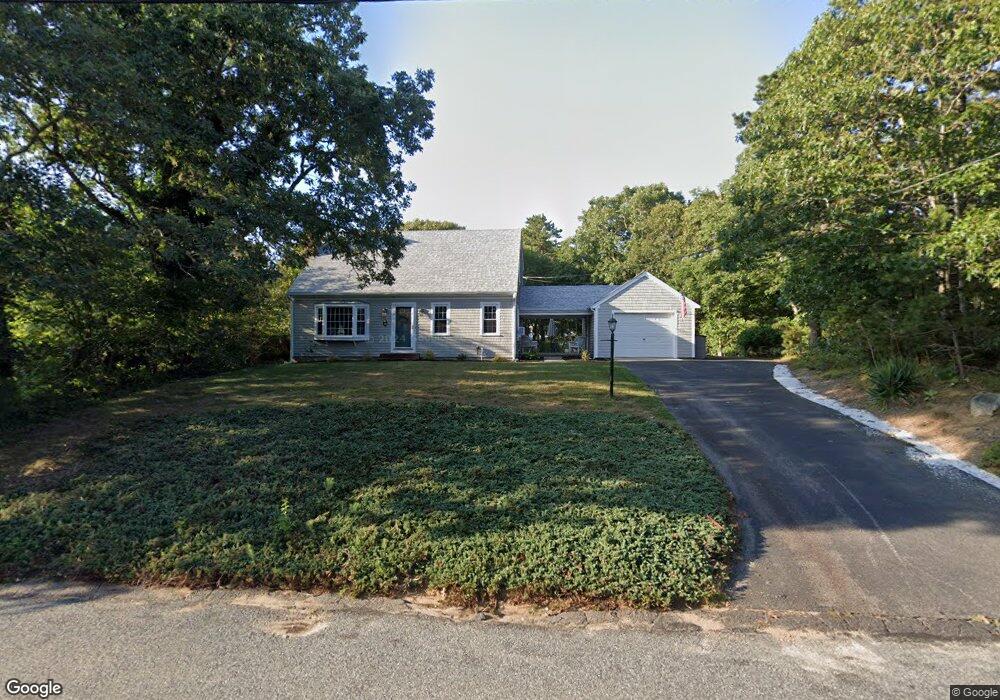
About This Home
This home is located at 38 Charles Rd, Harwich, MA 02645 and is currently estimated at $709,186, approximately $322 per square foot. 38 Charles Rd is a home located in Barnstable County with nearby schools including Harwich Elementary School, Chatham Elementary School, and Monomoy Regional Middle School.
Ownership History
We collect this data history from publicly available records. To have your information removed, we recommend requesting removal directly through your county’s website.
Purchase Details
Home Financials for this Owner
Home Financials are based on the most recent Mortgage that was taken out on this home.Purchase Details
Purchase Details
Home Values in the Area
Average Home Value in this Area
Purchase History
We collect this data history from publicly available records. To have your information removed, we recommend requesting removal directly through your county’s website.
| Date | Buyer | Sale Price | Title Company |
|---|---|---|---|
| $375,000 | None Available | ||
| -- | -- | ||
| $148,950 | -- |
Mortgage History
We collect this data history from publicly available records. To have your information removed, we recommend requesting removal directly through your county’s website.
| Date | Status | Borrower | Loan Amount |
|---|---|---|---|
| Open | $250,000 |
Tax History
We collect this data history from publicly available records. To have your information removed, we recommend requesting removal directly through your county’s website.
| Year | Tax Paid | Tax Assessment Tax Assessment Total Assessment is a certain percentage of the fair market value that is determined by local assessors to be the total taxable value of land and additions on the property. | Land | Improvement |
|---|---|---|---|---|
| 2025 | $3,735 | $632,000 | $236,500 | $395,500 |
| 2024 | $3,450 | $572,200 | $194,100 | $378,100 |
| 2023 | $3,303 | $497,400 | $176,400 | $321,000 |
| 2022 | $3,250 | $400,700 | $153,400 | $247,300 |
| 2021 | $3,136 | $364,700 | $139,500 | $225,200 |
| 2020 | $3,126 | $358,100 | $136,600 | $221,500 |
| 2019 | $2,995 | $345,400 | $131,200 | $214,200 |
| 2018 | $2,920 | $322,100 | $119,300 | $202,800 |
| 2017 | $2,764 | $308,100 | $108,700 | $199,400 |
| 2016 | $2,696 | $297,200 | $108,700 | $188,500 |
| 2015 | $2,599 | $289,700 | $106,600 | $183,100 |
| 2014 | $2,650 | $302,200 | $103,400 | $198,800 |
Map
- 2653 Main St
- 58 Marthas Ln
- 0 Tirrells Way
- 48 Sylvan Way
- 1 Peirce Path
- 58 Tirrells Way
- 50 Sylvan Way
- 252 Chatham Rd
- 2 Brettwood Rd
- 70 Uncle Deane's Rd
- 11 Little Marsh Ln
- 16 Turtle Run
- 18 Quail Trail
- 96 Stage Coach Dr
- 149 Island View Ln
- 1197 Orleans Rd
- 41 Idle Way
- 1025 Orleans-Harwich Rd
- 4 Skipper Shea Ln
- 6 Carefree Way
Ask me questions while you tour the home.