38 Crescent Dr Bridgewater, MA 02324
Estimated Value: $663,000 - $775,000
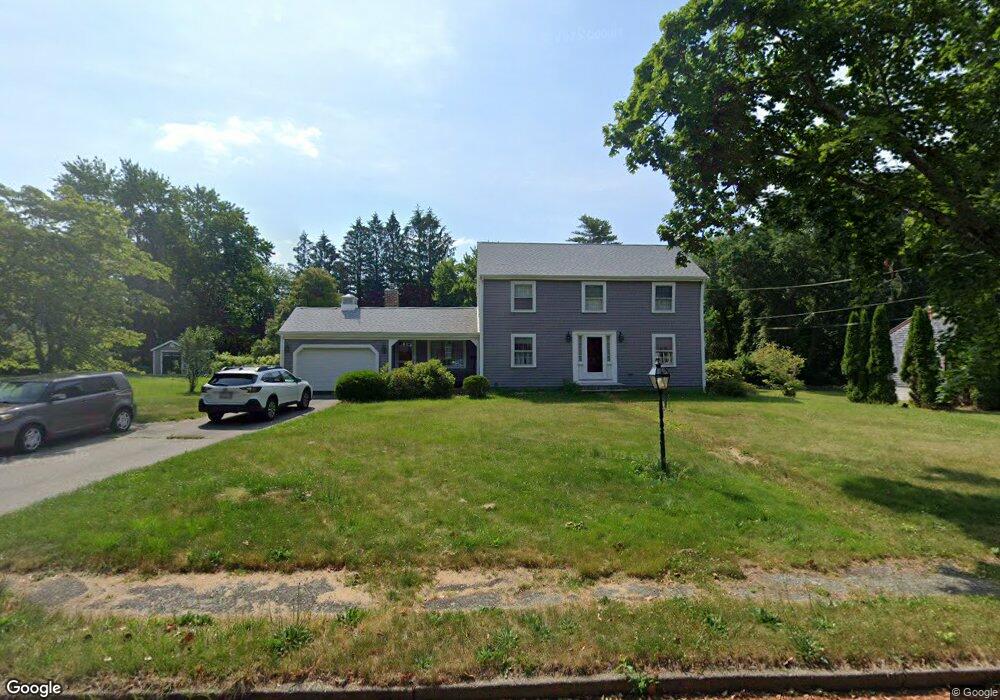
About This Home
This home is located at 38 Crescent Dr, Bridgewater, MA 02324 and is currently estimated at $721,789, approximately $313 per square foot. 38 Crescent Dr is a home located in Plymouth County with nearby schools including Mitchell Elementary School, Williams Intermediate School, and Bridgewater Middle School.
Ownership History
We collect this data history from publicly available records. To have your information removed, we recommend requesting removal directly through your county’s website.
Purchase Details
Purchase Details
Home Values in the Area
Average Home Value in this Area
Purchase History
We collect this data history from publicly available records. To have your information removed, we recommend requesting removal directly through your county’s website.
| Date | Buyer | Sale Price | Title Company |
|---|---|---|---|
| $413,300 | -- | ||
| $255,000 | -- |
Mortgage History
We collect this data history from publicly available records. To have your information removed, we recommend requesting removal directly through your county’s website.
| Date | Status | Borrower | Loan Amount |
|---|---|---|---|
| Closed | $150,000 | ||
| Closed | $280,000 |
Tax History
We collect this data history from publicly available records. To have your information removed, we recommend requesting removal directly through your county’s website.
| Year | Tax Paid | Tax Assessment Tax Assessment Total Assessment is a certain percentage of the fair market value that is determined by local assessors to be the total taxable value of land and additions on the property. | Land | Improvement |
|---|---|---|---|---|
| 2025 | $7,481 | $632,400 | $223,100 | $409,300 |
| 2024 | $7,268 | $598,700 | $212,400 | $386,300 |
| 2023 | $6,955 | $541,700 | $198,500 | $343,200 |
| 2022 | $6,876 | $480,200 | $174,200 | $306,000 |
| 2021 | $6,482 | $429,000 | $155,500 | $273,500 |
| 2020 | $8,533 | $412,900 | $149,500 | $263,400 |
| 2019 | $5,991 | $404,000 | $149,500 | $254,500 |
| 2018 | $5,825 | $383,500 | $145,200 | $238,300 |
| 2017 | $8,320 | $358,400 | $145,200 | $213,200 |
| 2016 | $5,358 | $344,800 | $142,400 | $202,400 |
| 2015 | $5,351 | $329,500 | $138,200 | $191,300 |
| 2014 | $5,202 | $320,100 | $134,100 | $186,000 |
Map
- 85 Fox Hill Dr
- 115 Springhill Ave
- 220 Bedford St Unit E-6
- 220 Bedford St Unit F4
- 220 Bedford St Unit 12D
- 220 Bedford St Unit B11
- 0 Bedford St Unit 73480500
- 180 Main St Unit 1109
- 180 Main St Unit A1
- 180 Main St Unit F147
- 180 Main St Unit B29
- 180 Main St Unit B34
- 180 Main St Unit 5109
- 180 Main St Unit f148
- 180 Main St Unit B32
- 112 Village Gate Dr
- 111 Main St
- 47 Hale St
- 418 Summer St
- 44 Old Forge Rd Unit 44
Ask me questions while you tour the home.