38 Jordan St Springfield, MA 01129
Sixteen Acres NeighborhoodEstimated Value: $339,000 - $436,000
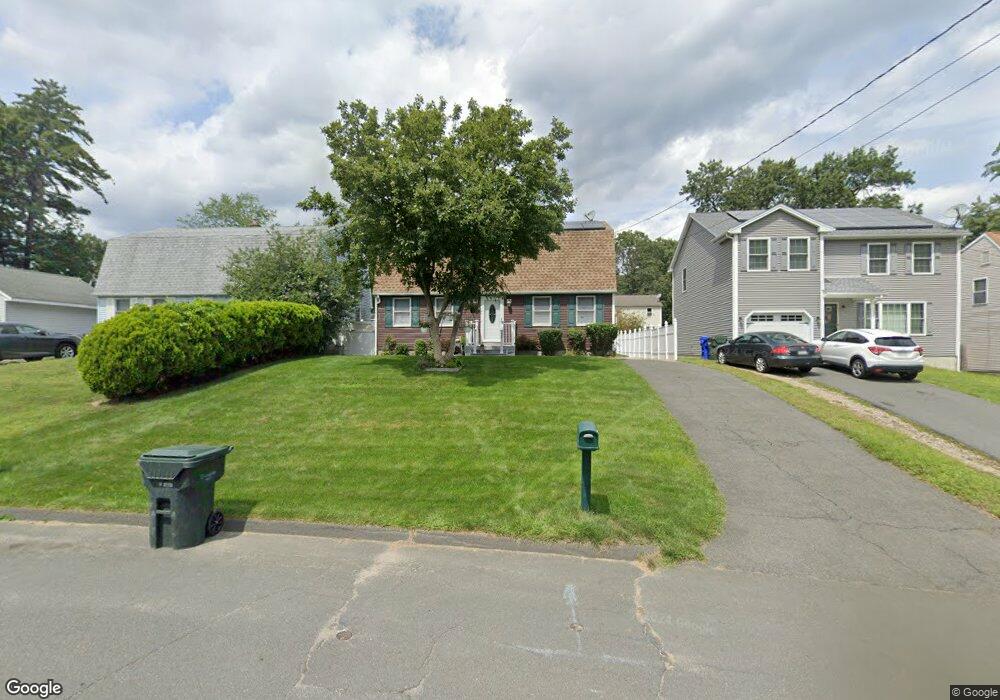
About This Home
This home is located at 38 Jordan St, Springfield, MA 01129 and is currently estimated at $380,714, approximately $203 per square foot. 38 Jordan St is a home located in Hampden County with nearby schools including Warner, M Marcus Kiley Middle, and Springfield Central High School.
Ownership History
We collect this data history from publicly available records. To have your information removed, we recommend requesting removal directly through your county’s website.
Purchase Details
Purchase Details
Home Values in the Area
Average Home Value in this Area
Purchase History
We collect this data history from publicly available records. To have your information removed, we recommend requesting removal directly through your county’s website.
| Date | Buyer | Sale Price | Title Company |
|---|---|---|---|
| $91,500 | -- | ||
| $91,900 | -- |
Mortgage History
We collect this data history from publicly available records. To have your information removed, we recommend requesting removal directly through your county’s website.
| Date | Status | Borrower | Loan Amount |
|---|---|---|---|
| Open | $159,500 | ||
| Closed | $169,479 | ||
| Closed | $35,000 | ||
| Closed | $25,000 | ||
| Previous Owner | $85,500 | ||
| Previous Owner | $84,000 |
Tax History
We collect this data history from publicly available records. To have your information removed, we recommend requesting removal directly through your county’s website.
| Year | Tax Paid | Tax Assessment Tax Assessment Total Assessment is a certain percentage of the fair market value that is determined by local assessors to be the total taxable value of land and additions on the property. | Land | Improvement |
|---|---|---|---|---|
| 2025 | $4,925 | $314,100 | $56,900 | $257,200 |
| 2024 | $4,948 | $308,100 | $56,900 | $251,200 |
| 2023 | $4,823 | $282,900 | $54,200 | $228,700 |
| 2022 | $4,261 | $226,400 | $54,200 | $172,200 |
| 2021 | $4,500 | $238,100 | $49,300 | $188,800 |
| 2020 | $4,019 | $205,800 | $49,300 | $156,500 |
| 2019 | $3,903 | $198,300 | $49,300 | $149,000 |
| 2018 | $3,891 | $197,700 | $49,300 | $148,400 |
| 2017 | $3,783 | $192,400 | $44,500 | $147,900 |
| 2016 | $3,706 | $188,500 | $44,500 | $144,000 |
| 2015 | $3,366 | $171,100 | $44,500 | $126,600 |
Map
- 183 Jewett St
- 147 Parkerview St
- 110 Parkerview St
- 135 Bulat Dr
- 161 Fernbank Rd
- 19-21 Wedgewood Cir
- 37 Parkerview St
- 679 Parker St
- 91 Spikenard Cir
- 202 Spikenard Cir
- 373 Nassau Dr
- 371 Nassau Dr
- 31 Shirley St
- 46-48 Kent Rd
- 6V Melikian Dr
- 19-21 Biddle St
- 276 Spikenard Cir
- 113 Nassau Dr
- 161 Nassau Dr
- 220 Nassau Dr
- 44 Jordan St
- 34 Jordan St
- 48 Jordan St
- 26 Jordan St
- 52 Jordan St
- 281 Parkerview St
- 285 Parkerview St
- 271 Parkerview St
- 287 Parkerview St
- 287 Parkerview St
- 56 Jordan St
- 37 Jordan St
- 295 Parkerview St
- 265 Parkerview St Unit 267
- 27 Jordan St
- 47 Jordan St
- 2 lots Jordan St
- 301 Parkerview St
- 64 Jordan St
- 53 Jordan St
Ask me questions while you tour the home.