38 Longview Dr Wilbraham, MA 01095
Estimated Value: $437,031 - $586,000
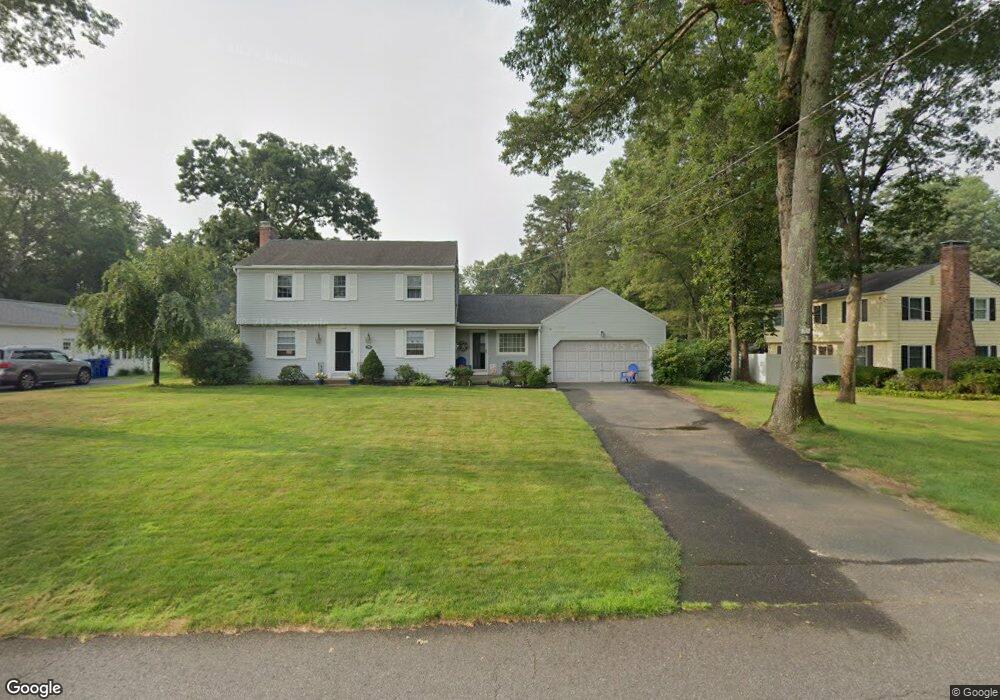
About This Home
This home is located at 38 Longview Dr, Wilbraham, MA 01095 and is currently estimated at $505,508, approximately $282 per square foot. 38 Longview Dr is a home located in Hampden County with nearby schools including Minnechaug Regional High School and Wilbraham & Monson Academy.
Ownership History
We collect this data history from publicly available records. To have your information removed, we recommend requesting removal directly through your county’s website.
Purchase Details
Home Financials for this Owner
Home Financials are based on the most recent Mortgage that was taken out on this home.Home Values in the Area
Average Home Value in this Area
Purchase History
We collect this data history from publicly available records. To have your information removed, we recommend requesting removal directly through your county’s website.
| Date | Buyer | Sale Price | Title Company |
|---|---|---|---|
| $168,000 | -- |
Mortgage History
We collect this data history from publicly available records. To have your information removed, we recommend requesting removal directly through your county’s website.
| Date | Status | Borrower | Loan Amount |
|---|---|---|---|
| Open | $118,000 | ||
| Previous Owner | $72,000 | ||
| Previous Owner | $72,000 |
Tax History
We collect this data history from publicly available records. To have your information removed, we recommend requesting removal directly through your county’s website.
| Year | Tax Paid | Tax Assessment Tax Assessment Total Assessment is a certain percentage of the fair market value that is determined by local assessors to be the total taxable value of land and additions on the property. | Land | Improvement |
|---|---|---|---|---|
| 2025 | $6,564 | $367,100 | $97,600 | $269,500 |
| 2024 | $6,425 | $347,300 | $97,600 | $249,700 |
| 2023 | $5,993 | $320,500 | $97,600 | $222,900 |
| 2022 | $6,026 | $294,100 | $97,600 | $196,500 |
| 2021 | $5,722 | $249,200 | $104,900 | $144,300 |
| 2020 | $5,577 | $249,200 | $104,900 | $144,300 |
| 2019 | $5,433 | $249,200 | $104,900 | $144,300 |
| 2018 | $5,459 | $241,100 | $104,900 | $136,200 |
| 2017 | $5,304 | $241,100 | $104,900 | $136,200 |
| 2016 | $5,262 | $243,600 | $116,500 | $127,100 |
| 2015 | $5,086 | $243,600 | $116,500 | $127,100 |
Map
- 2 Christopher Cir
- 13 Pleasant View Rd
- 17 Raymond Dr
- 9 Park Dr
- 936 Stony Hill Rd
- 9 Branch Rd
- 460 Soule Rd
- 230V Burleigh Rd
- 338 Wilbraham Rd
- 767 Stony Hill Rd
- 763 Stony Hill Rd
- 38 Evergreen Dr
- 15 Ripley St
- 717-719 Stony Hill Rd
- 24 Deerfoot Dr
- 6 Brookmont Dr
- 19 Overlook Dr
- 35 Tioga St
- 161 Raymond Dr
- 62 Millbrook Dr
Ask me questions while you tour the home.