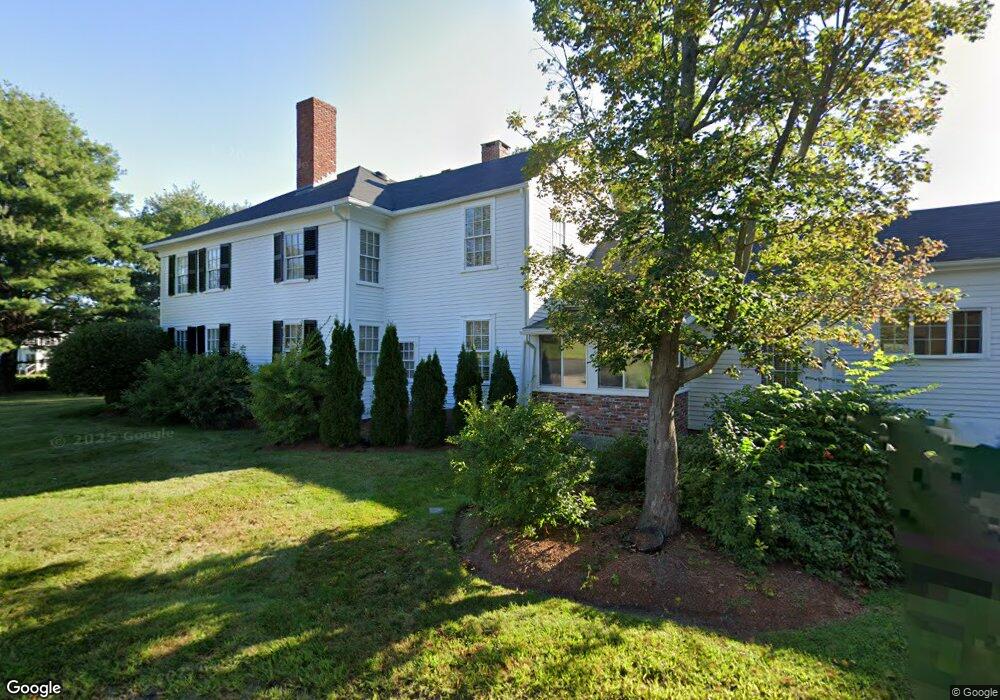
38 Maple St Mendon, MA 01756
Estimated Value: $634,000 - $872,000
5
Beds
3
Baths
3,780
Sq Ft
$196/Sq Ft
Est. Value
About This Home
This home is located at 38 Maple St, Mendon, MA 01756 and is currently estimated at $741,998, approximately $196 per square foot. 38 Maple St is a home located in Worcester County with nearby schools including Nipmuc Regional High School and Bethany Christian Academy.
Ownership History
Date
Name
Owned For
Owner Type
Purchase Details
Closed on
Aug 9, 2021
Sold by
Collins Sharon A
Bought by
Sharon A Collins Ret
Current Estimated Value
Purchase Details
Closed on
Jul 16, 1976
Bought by
Collins John A and Collins Sharon A
Create a Home Valuation Report for This Property
The Home Valuation Report is an in-depth analysis detailing your home's value as well as a comparison with similar homes in the area
Home Values in the Area
Average Home Value in this Area
Purchase History
| Date | Buyer | Sale Price | Title Company |
|---|---|---|---|
| Sharon A Collins Ret | -- | None Available | |
| Collins John A | -- | -- |
Source: Public Records
Mortgage History
| Date | Status | Borrower | Loan Amount |
|---|---|---|---|
| Previous Owner | Collins John A | $137,500 | |
| Previous Owner | Collins John A | $157,500 | |
| Previous Owner | Collins John A | $153,000 |
Source: Public Records
Tax History
| Year | Tax Paid | Tax Assessment Tax Assessment Total Assessment is a certain percentage of the fair market value that is determined by local assessors to be the total taxable value of land and additions on the property. | Land | Improvement |
|---|---|---|---|---|
| 2025 | $10,293 | $768,700 | $166,300 | $602,400 |
| 2024 | $10,102 | $736,800 | $159,900 | $576,900 |
| 2023 | $9,772 | $669,300 | $142,700 | $526,600 |
| 2022 | $9,425 | $611,600 | $139,000 | $472,600 |
| 2021 | $9,043 | $538,600 | $134,900 | $403,700 |
| 2020 | $8,606 | $513,800 | $134,900 | $378,900 |
| 2019 | $8,390 | $501,200 | $131,000 | $370,200 |
| 2018 | $8,319 | $490,500 | $131,000 | $359,500 |
| 2017 | $8,264 | $465,600 | $131,000 | $334,600 |
| 2016 | $8,087 | $468,800 | $139,000 | $329,800 |
| 2015 | $7,333 | $458,000 | $139,000 | $319,000 |
| 2014 | $6,991 | $436,400 | $134,700 | $301,700 |
Source: Public Records
Map
Nearby Homes
- 23 Uxbridge Rd
- 27 Taft Ave
- 3 Daniels Rd
- 65 Milford St
- 106 Laurelwood Dr Unit 106
- 89 Laurelwood Dr Unit 89
- 129 Mill St
- 183 Blackstone St
- 17 Park St
- 55 Northbridge Rd
- 29 Thornton St
- 93 Providence St Unit B
- 25 Bens Way
- 23 Bens Way
- 8 Puffer Dr
- 19 Bens Way
- 17 Forest Park Dr
- 50 Hartford Ave E
- 16 Heron Ln
- 16 Bancroft Park
Your Personal Tour Guide
Ask me questions while you tour the home.