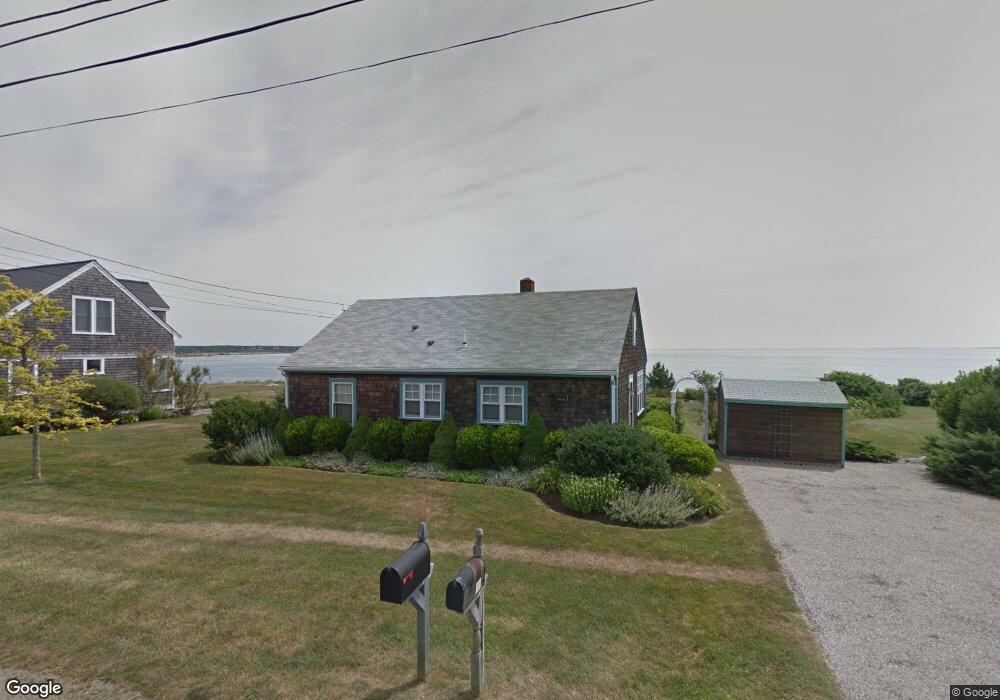
38 Ocean Dr Little Compton, RI 02837
Little Compton AreaEstimated Value: $1,609,000 - $1,977,000
About This Home
This home is located at 38 Ocean Dr, Little Compton, RI 02837 and is currently estimated at $1,825,131, approximately $910 per square foot. 38 Ocean Dr is a home located in Newport County with nearby schools including Wilbur & McMahon School.
Ownership History
We collect this data history from publicly available records. To have your information removed, we recommend requesting removal directly through your county’s website.
Purchase Details
Home Values in the Area
Average Home Value in this Area
Purchase History
We collect this data history from publicly available records. To have your information removed, we recommend requesting removal directly through your county’s website.
| Date | Buyer | Sale Price | Title Company |
|---|---|---|---|
| $590,000 | -- |
Mortgage History
We collect this data history from publicly available records. To have your information removed, we recommend requesting removal directly through your county’s website.
| Date | Status | Borrower | Loan Amount |
|---|---|---|---|
| Open | $300,000 | ||
| Open | $464,000 | ||
| Previous Owner | $78,155 |
Tax History
We collect this data history from publicly available records. To have your information removed, we recommend requesting removal directly through your county’s website.
| Year | Tax Paid | Tax Assessment Tax Assessment Total Assessment is a certain percentage of the fair market value that is determined by local assessors to be the total taxable value of land and additions on the property. | Land | Improvement |
|---|---|---|---|---|
| 2025 | $7,770 | $1,622,100 | $1,119,600 | $502,500 |
| 2024 | $6,739 | $1,326,600 | $865,000 | $461,600 |
| 2023 | $6,580 | $1,326,600 | $865,000 | $461,600 |
| 2022 | $6,500 | $1,326,600 | $865,000 | $461,600 |
| 2021 | $7,180 | $1,188,700 | $752,000 | $436,700 |
| 2020 | $7,120 | $1,188,700 | $752,000 | $436,700 |
| 2019 | $6,224 | $1,049,500 | $752,000 | $297,500 |
| 2018 | $4,746 | $796,300 | $681,500 | $114,800 |
| 2016 | $4,515 | $796,300 | $681,500 | $114,800 |
| 2015 | $4,336 | $754,000 | $641,100 | $112,900 |
| 2014 | $4,253 | $754,000 | $641,100 | $112,900 |
Map
- 89 S Shore Rd
- 1 Butts Rock Rd
- 24 Point Meadows Rd
- 35 Wild Cherry Dr
- 73 Quaker Hill Farm Rd
- 6 Moorings Way
- 141 S Of Commons Rd
- 5 Ellsworth Dr
- 3 Richmond Pond Dr
- 3 Richmond Pond Ln
- 246 Howland Rd
- 571 W Main Rd
- 185 Howland Rd
- 60 Snell Rd
- 115 Howland Rd
- 536 W Main Rd
- 94 Howland Rd
- 138 Willow Ave
- 99 Pottersville Rd
- 43 Baileys Ledge Rd
Ask me questions while you tour the home.