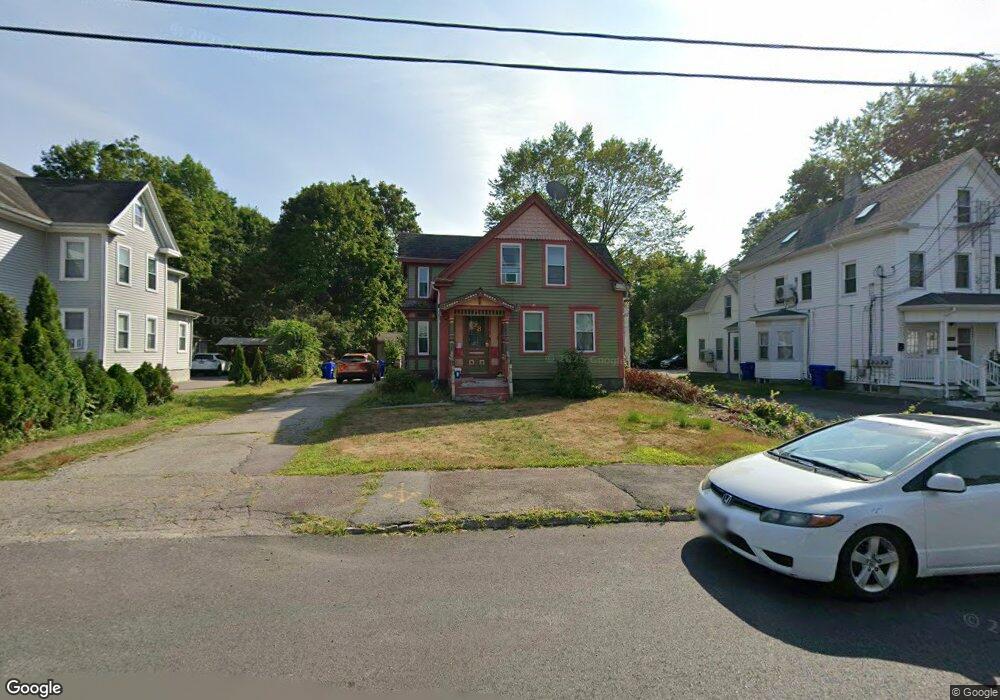
38 Pine St Taunton, MA 02780
Estimated Value: $532,829 - $655,000
3
Beds
2
Baths
1,904
Sq Ft
$313/Sq Ft
Est. Value
About This Home
This home is located at 38 Pine St, Taunton, MA 02780 and is currently estimated at $595,457, approximately $312 per square foot. 38 Pine St is a home located in Bristol County with nearby schools including H. H. Galligan School, Benjamin Friedman Middle School, and Taunton High School.
Ownership History
Date
Name
Owned For
Owner Type
Purchase Details
Closed on
Mar 30, 2011
Sold by
Fielding Thomas A
Bought by
Stande Albert W
Current Estimated Value
Home Financials for this Owner
Home Financials are based on the most recent Mortgage that was taken out on this home.
Original Mortgage
$200,000
Outstanding Balance
$136,028
Interest Rate
5.04%
Mortgage Type
Purchase Money Mortgage
Estimated Equity
$459,429
Purchase Details
Closed on
Jun 15, 1998
Sold by
Chappell John C and Chappell John C
Bought by
Fielding Thomas A
Home Financials for this Owner
Home Financials are based on the most recent Mortgage that was taken out on this home.
Original Mortgage
$95,500
Interest Rate
7.11%
Mortgage Type
Purchase Money Mortgage
Create a Home Valuation Report for This Property
The Home Valuation Report is an in-depth analysis detailing your home's value as well as a comparison with similar homes in the area
Home Values in the Area
Average Home Value in this Area
Purchase History
| Date | Buyer | Sale Price | Title Company |
|---|---|---|---|
| Stande Albert W | $200,000 | -- | |
| Fielding Thomas A | $57,000 | -- |
Source: Public Records
Mortgage History
| Date | Status | Borrower | Loan Amount |
|---|---|---|---|
| Open | Stande Albert W | $200,000 | |
| Previous Owner | Fielding Thomas A | $95,500 |
Source: Public Records
Tax History
| Year | Tax Paid | Tax Assessment Tax Assessment Total Assessment is a certain percentage of the fair market value that is determined by local assessors to be the total taxable value of land and additions on the property. | Land | Improvement |
|---|---|---|---|---|
| 2025 | $5,582 | $510,200 | $122,800 | $387,400 |
| 2024 | $5,386 | $481,300 | $122,800 | $358,500 |
| 2023 | $5,043 | $418,500 | $122,800 | $295,700 |
| 2022 | $4,542 | $344,600 | $102,300 | $242,300 |
| 2021 | $4,409 | $310,500 | $93,000 | $217,500 |
| 2020 | $4,303 | $289,600 | $93,000 | $196,600 |
| 2019 | $3,934 | $249,600 | $93,000 | $156,600 |
| 2018 | $3,790 | $241,100 | $94,000 | $147,100 |
| 2017 | $3,500 | $222,800 | $89,100 | $133,700 |
| 2016 | $3,363 | $214,500 | $86,500 | $128,000 |
| 2015 | $3,017 | $201,000 | $85,400 | $115,600 |
| 2014 | $2,951 | $202,000 | $85,400 | $116,600 |
Source: Public Records
Map
Nearby Homes
Your Personal Tour Guide
Ask me questions while you tour the home.