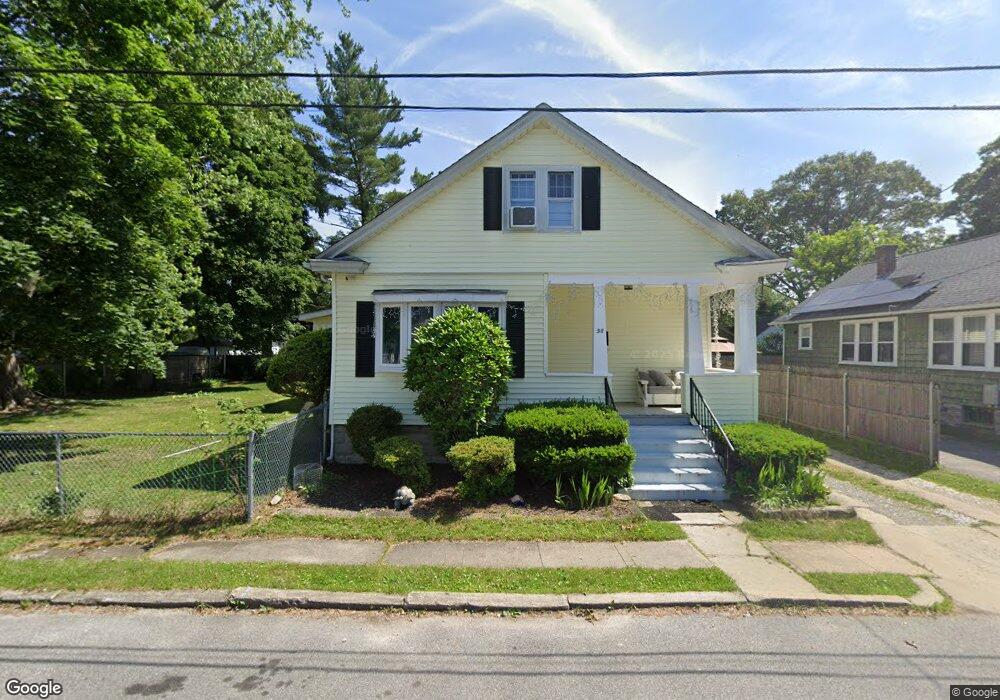
38 Prince St Warwick, RI 02888
Lakewood NeighborhoodEstimated Value: $399,000 - $476,000
About This Home
This home is located at 38 Prince St, Warwick, RI 02888 and is currently estimated at $436,328, approximately $296 per square foot. 38 Prince St is a home located in Kent County with nearby schools including Saint Paul School and St. Peter School.
Ownership History
We collect this data history from publicly available records. To have your information removed, we recommend requesting removal directly through your county’s website.
Purchase Details
Home Financials for this Owner
Home Financials are based on the most recent Mortgage that was taken out on this home.Home Values in the Area
Average Home Value in this Area
Purchase History
We collect this data history from publicly available records. To have your information removed, we recommend requesting removal directly through your county’s website.
| Date | Buyer | Sale Price | Title Company |
|---|---|---|---|
| $125,000 | -- | ||
| $125,000 | -- |
Mortgage History
We collect this data history from publicly available records. To have your information removed, we recommend requesting removal directly through your county’s website.
| Date | Status | Borrower | Loan Amount |
|---|---|---|---|
| Open | $118,750 | ||
| Closed | $118,750 |
Tax History
We collect this data history from publicly available records. To have your information removed, we recommend requesting removal directly through your county’s website.
| Year | Tax Paid | Tax Assessment Tax Assessment Total Assessment is a certain percentage of the fair market value that is determined by local assessors to be the total taxable value of land and additions on the property. | Land | Improvement |
|---|---|---|---|---|
| 2025 | $5,010 | $394,500 | $104,800 | $289,700 |
| 2024 | $4,089 | $282,600 | $80,200 | $202,400 |
| 2023 | $3,912 | $275,700 | $73,300 | $202,400 |
| 2022 | $3,759 | $200,700 | $48,200 | $152,500 |
| 2021 | $3,759 | $200,700 | $48,200 | $152,500 |
| 2020 | $3,759 | $200,700 | $48,200 | $152,500 |
| 2019 | $3,759 | $200,700 | $48,200 | $152,500 |
| 2018 | $2,974 | $143,000 | $39,400 | $103,600 |
| 2017 | $2,894 | $143,000 | $39,400 | $103,600 |
| 2016 | $2,894 | $143,000 | $39,400 | $103,600 |
| 2015 | $3,185 | $153,500 | $51,300 | $102,200 |
| 2014 | $3,079 | $153,500 | $51,300 | $102,200 |
| 2013 | $3,038 | $153,500 | $51,300 | $102,200 |
Map
- 99 Dryden Blvd
- 111 Roger Williams Cir
- 200 Post Rd Unit 610
- 200 Post Rd Unit 319
- 161 Adams St
- 136 Sherwood Ave
- 31 Denver Ave
- 11 Palm Blvd
- 70 Perkins Ave
- 64 Perkins Ave
- 9 Youlden Ave
- 70 Tucker Ave
- 234 3rd Ave
- 189 Underwood Ave
- 27 Cliffdale Ave
- 200 Underwood Ave
- 18 Harding Ave
- 31 Errol St
- 79 Arcadia Ave
- 9 George Cir
Ask me questions while you tour the home.