Estimated Value: $467,033 - $505,000
About This Home
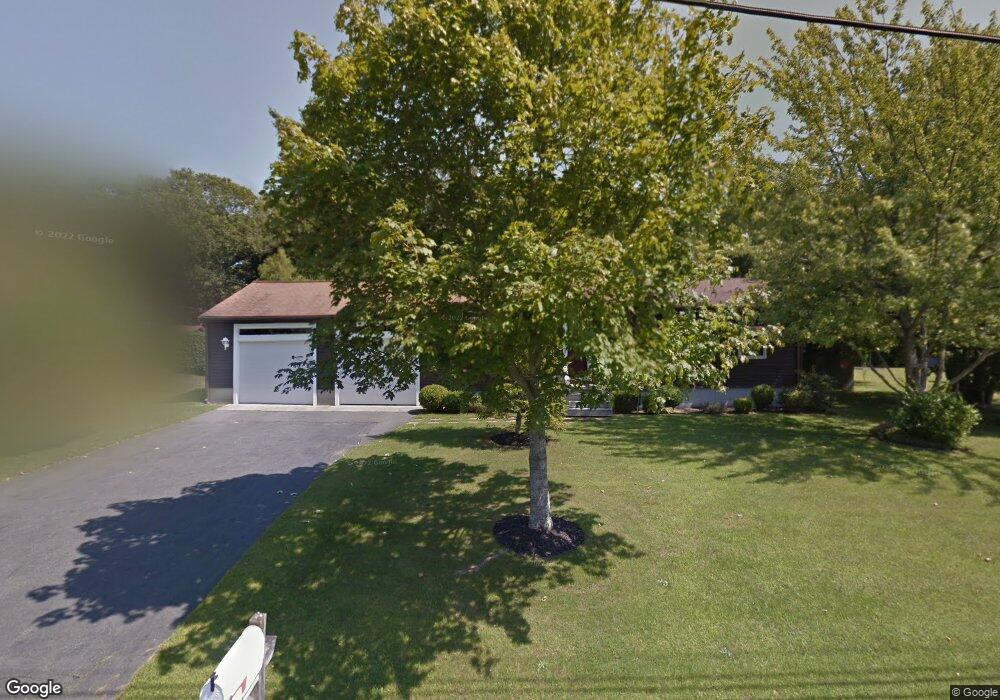
This home is located at 38 Ruby Ct, North Dartmouth, MA 02747 and is currently estimated at $479,508, approximately $475 per square foot. 38 Ruby Ct is a home located in Bristol County with nearby schools including Dartmouth High School, Friends Academy, and Nazarene Christian Academy.
Ownership History
We collect this data history from publicly available records. To have your information removed, we recommend requesting removal directly through your county’s website.
Purchase Details
Home Financials for this Owner
Home Financials are based on the most recent Mortgage that was taken out on this home.Home Values in the Area
Average Home Value in this Area
Purchase History
We collect this data history from publicly available records. To have your information removed, we recommend requesting removal directly through your county’s website.
| Date | Buyer | Sale Price | Title Company |
|---|---|---|---|
| $128,000 | -- |
Mortgage History
We collect this data history from publicly available records. To have your information removed, we recommend requesting removal directly through your county’s website.
| Date | Status | Borrower | Loan Amount |
|---|---|---|---|
| Open | $120,800 | ||
| Closed | $25,000 | ||
| Closed | $110,700 | ||
| Closed | $115,000 |
Tax History
We collect this data history from publicly available records. To have your information removed, we recommend requesting removal directly through your county’s website.
| Year | Tax Paid | Tax Assessment Tax Assessment Total Assessment is a certain percentage of the fair market value that is determined by local assessors to be the total taxable value of land and additions on the property. | Land | Improvement |
|---|---|---|---|---|
| 2025 | $3,433 | $398,700 | $175,600 | $223,100 |
| 2024 | $3,306 | $380,400 | $167,500 | $212,900 |
| 2023 | $3,190 | $347,900 | $155,400 | $192,500 |
| 2022 | $3,062 | $309,300 | $148,600 | $160,700 |
| 2021 | $2,867 | $276,700 | $131,200 | $145,500 |
| 2020 | $2,806 | $270,300 | $131,200 | $139,100 |
| 2019 | $2,792 | $268,500 | $131,200 | $137,300 |
| 2018 | $2,558 | $253,000 | $131,200 | $121,800 |
| 2017 | $2,439 | $243,400 | $123,800 | $119,600 |
| 2016 | $2,399 | $236,100 | $123,800 | $112,300 |
| 2015 | $2,326 | $229,400 | $115,700 | $113,700 |
| 2014 | $2,206 | $216,100 | $104,900 | $111,200 |
Map
- 824 Tucker Rd
- 61 Bayberry Ln
- 13 Northfield Ln
- 34 Colonial Way
- 15 Mishawum Dr
- 4 Merrymount Dr
- 10 Slocum Farm Dr
- 18 Stratford Dr
- 504 Russells Mills Rd
- 29 Elizabeth Ct
- 21 Juniper Ridge Ln Unit 21
- 6 Strathmore Rd
- 40 Sable Ave
- 11 Stoney Brook Ln
- 6 Hilltop Rd
- 1157 Tucker Rd
- 15 George St
- 219 Chase Rd
- 415 Chase Rd
- 220 Rockland St
Ask me questions while you tour the home.