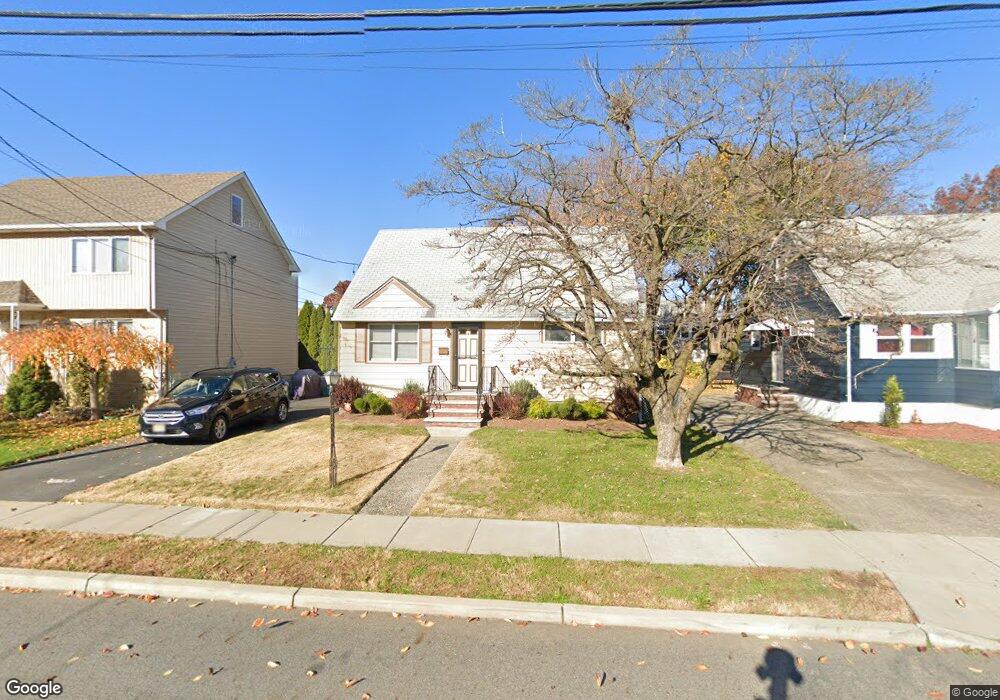
38 Runyon Rd Clifton, NJ 07013
Richfield NeighborhoodEstimated Value: $463,639 - $566,000
Studio
--
Bath
1,248
Sq Ft
$423/Sq Ft
Est. Value
About This Home
This home is located at 38 Runyon Rd, Clifton, NJ 07013 and is currently estimated at $527,410, approximately $422 per square foot. 38 Runyon Rd is a home located in Passaic County with nearby schools including Clifton High School, St Andrew Elementary School, and New Hope School.
Ownership History
Date
Name
Owned For
Owner Type
Purchase Details
Closed on
Sep 12, 1997
Sold by
Blondek Dolores and Palsi Celia
Bought by
Carson Kenneth J and Carson Gail A
Current Estimated Value
Home Financials for this Owner
Home Financials are based on the most recent Mortgage that was taken out on this home.
Original Mortgage
$134,691
Outstanding Balance
$20,965
Interest Rate
7.52%
Mortgage Type
FHA
Estimated Equity
$506,445
Create a Home Valuation Report for This Property
The Home Valuation Report is an in-depth analysis detailing your home's value as well as a comparison with similar homes in the area
Home Values in the Area
Average Home Value in this Area
Purchase History
| Date | Buyer | Sale Price | Title Company |
|---|---|---|---|
| Carson Kenneth J | $139,000 | -- |
Source: Public Records
Mortgage History
| Date | Status | Borrower | Loan Amount |
|---|---|---|---|
| Open | Carson Kenneth J | $134,691 |
Source: Public Records
Tax History
| Year | Tax Paid | Tax Assessment Tax Assessment Total Assessment is a certain percentage of the fair market value that is determined by local assessors to be the total taxable value of land and additions on the property. | Land | Improvement |
|---|---|---|---|---|
| 2025 | $8,601 | $144,900 | $92,500 | $52,400 |
| 2024 | $8,396 | $144,900 | $92,500 | $52,400 |
| 2022 | $8,274 | $144,900 | $92,500 | $52,400 |
| 2021 | $7,933 | $144,900 | $92,500 | $52,400 |
| 2020 | $7,959 | $144,900 | $92,500 | $52,400 |
| 2019 | $7,903 | $144,900 | $92,500 | $52,400 |
| 2018 | $7,858 | $144,900 | $92,500 | $52,400 |
| 2017 | $7,772 | $144,900 | $92,500 | $52,400 |
| 2016 | $7,622 | $144,900 | $92,500 | $52,400 |
| 2015 | $7,548 | $144,900 | $92,500 | $52,400 |
| 2014 | $7,393 | $144,900 | $92,500 | $52,400 |
Source: Public Records
Map
Nearby Homes
- 62 Runyon Rd
- 4 Oak Ridge Rd
- 59 Pershing Rd
- 174 Colfax Ave
- 135 La Salle Ave
- 191 Pershing Rd
- 191 Pershing Rd Unit 2
- 429 Clifton Blvd
- 117 Fornelius Ave
- 448 Clifton Blvd
- 44 Liberty St
- 17 Emma Place
- 438 Mount Prospect Ave
- 375 Colfax Ave
- 150 Beverly Hill Rd
- 26 Major St
- 80 Major St
- 389 Colfax Ave
- 337 Madison Ave
- 9 Joan Place
Your Personal Tour Guide
Ask me questions while you tour the home.