38 Snell St Brockton, MA 02301
Montello NeighborhoodEstimated Value: $467,000 - $504,000
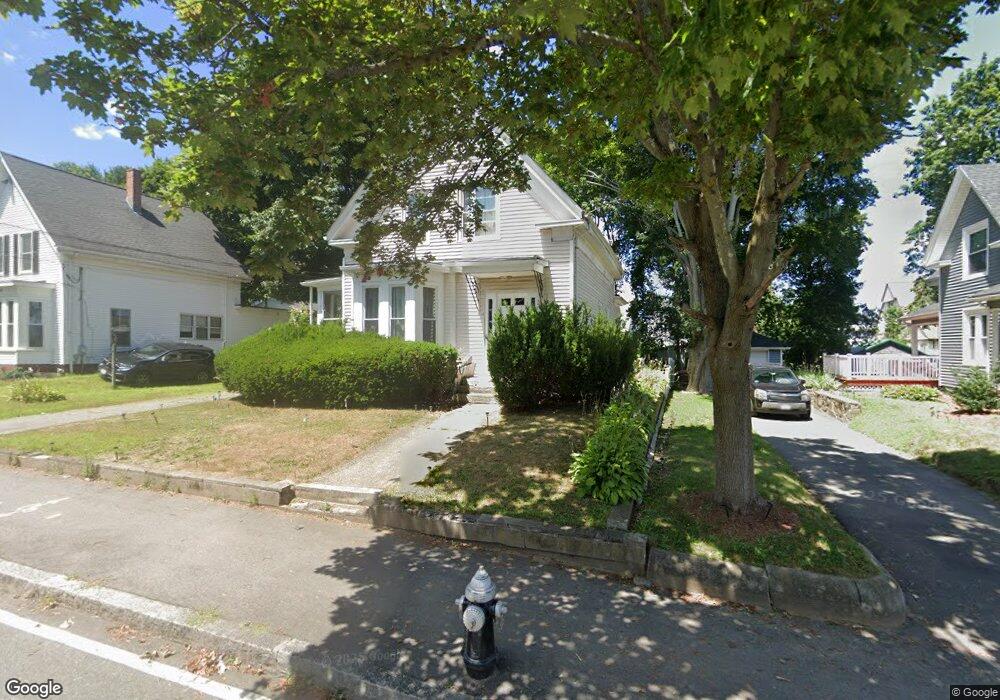
About This Home
This home is located at 38 Snell St, Brockton, MA 02301 and is currently estimated at $479,833, approximately $320 per square foot. 38 Snell St is a home located in Plymouth County with nearby schools including Raymond K-8 Elementary School, Louis F Angelo Elementary School, and Manthala George Jr. School.
Ownership History
We collect this data history from publicly available records. To have your information removed, we recommend requesting removal directly through your county’s website.
Purchase Details
Purchase Details
Home Financials for this Owner
Home Financials are based on the most recent Mortgage that was taken out on this home.Home Values in the Area
Average Home Value in this Area
Purchase History
We collect this data history from publicly available records. To have your information removed, we recommend requesting removal directly through your county’s website.
| Date | Buyer | Sale Price | Title Company |
|---|---|---|---|
| -- | -- | ||
| $182,000 | -- |
Mortgage History
We collect this data history from publicly available records. To have your information removed, we recommend requesting removal directly through your county’s website.
| Date | Status | Borrower | Loan Amount |
|---|---|---|---|
| Previous Owner | $227,000 | ||
| Previous Owner | $216,750 | ||
| Previous Owner | $183,000 | ||
| Previous Owner | $172,900 |
Tax History
We collect this data history from publicly available records. To have your information removed, we recommend requesting removal directly through your county’s website.
| Year | Tax Paid | Tax Assessment Tax Assessment Total Assessment is a certain percentage of the fair market value that is determined by local assessors to be the total taxable value of land and additions on the property. | Land | Improvement |
|---|---|---|---|---|
| 2025 | $5,078 | $419,300 | $140,400 | $278,900 |
| 2024 | $4,759 | $395,900 | $140,400 | $255,500 |
| 2023 | $4,481 | $345,200 | $105,800 | $239,400 |
| 2022 | $4,609 | $329,900 | $96,200 | $233,700 |
| 2021 | $4,112 | $283,600 | $80,200 | $203,400 |
| 2020 | $3,995 | $263,700 | $74,800 | $188,900 |
| 2019 | $4,082 | $262,700 | $72,900 | $189,800 |
| 2018 | $3,512 | $218,700 | $72,900 | $145,800 |
| 2017 | $3,259 | $202,400 | $72,900 | $129,500 |
| 2016 | $3,191 | $183,800 | $70,700 | $113,100 |
| 2015 | $2,764 | $152,300 | $70,700 | $81,600 |
| 2014 | $2,814 | $155,200 | $70,700 | $84,500 |
Map
- 863 N Main St
- 9 Gaudette Ave
- 55 Orchard Ave
- 21 Sutton St
- 221 Oak St Unit 4-31
- 221 Oak St Unit 17-12
- 221 Oak St Unit 12-15
- 4 Bellevue Ave
- 178 Oak St
- 30 Intervale St
- 70 Addison St
- 62 Arthur St
- 10 Banks St
- 72 Kurland Ave
- 125 Burkeside Ave
- 478 E Main St
- 35 Eagle Ave Unit 7
- 112 Ford St
- 112 1/2 Ford
- 50 Baltic Ave
Ask me questions while you tour the home.