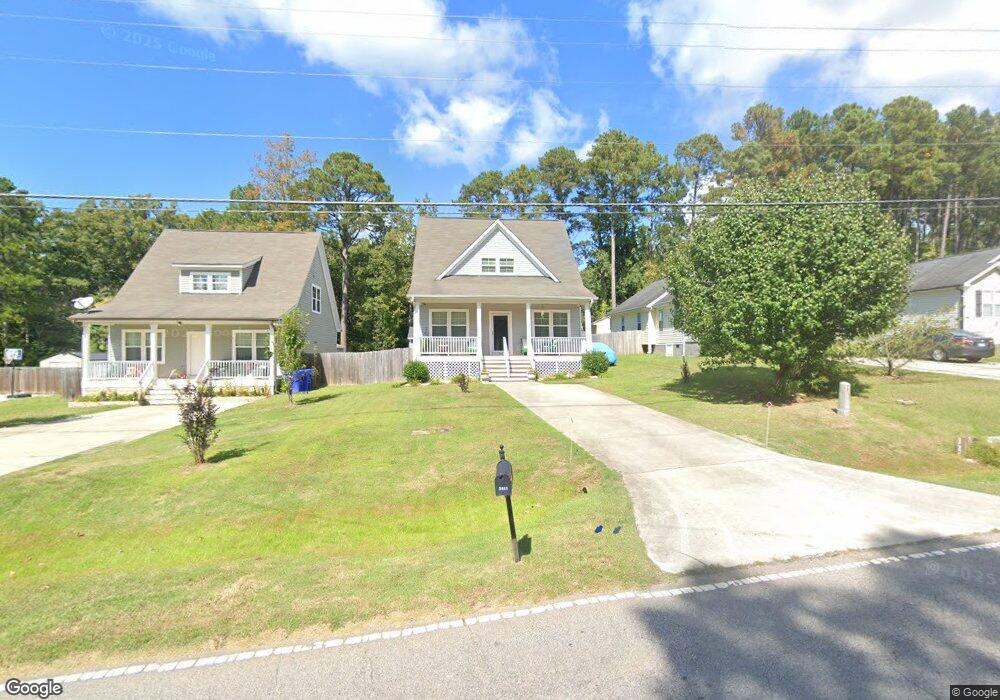
3811 Freeman Rd Unit 18 Durham, NC 27703
Eastern Durham NeighborhoodEstimated Value: $277,000 - $336,000
3
Beds
3
Baths
1,512
Sq Ft
$201/Sq Ft
Est. Value
About This Home
This home is located at 3811 Freeman Rd Unit 18, Durham, NC 27703 and is currently estimated at $304,429, approximately $201 per square foot. 3811 Freeman Rd Unit 18 is a home located in Durham County with nearby schools including Glenn Elementary, John W Neal Middle School, and Southern School of Energy & Sustainability.
Ownership History
Date
Name
Owned For
Owner Type
Purchase Details
Closed on
Jan 8, 2020
Sold by
Singh Tej Kaur
Bought by
Singh Tej Kaur and Tej Kaur Singh Living Trust
Current Estimated Value
Purchase Details
Closed on
Dec 4, 2017
Sold by
White Darrell
Bought by
Singh Tej Kaur
Purchase Details
Closed on
Dec 31, 2014
Sold by
Ga4rma Homes Llc
Bought by
White Darrell
Home Financials for this Owner
Home Financials are based on the most recent Mortgage that was taken out on this home.
Original Mortgage
$137,362
Interest Rate
3.62%
Mortgage Type
FHA
Purchase Details
Closed on
May 22, 2014
Sold by
Zinger Charles R
Bought by
Garman Homes Llc
Purchase Details
Closed on
Aug 14, 2009
Sold by
Roberts Bryant B and Roberts Deborah B
Bought by
Zinger Charles R
Purchase Details
Closed on
Apr 20, 2007
Sold by
Obrian William E and Obrian Anna H
Bought by
Roberts Bryant B
Home Financials for this Owner
Home Financials are based on the most recent Mortgage that was taken out on this home.
Original Mortgage
$26,894
Interest Rate
6.11%
Mortgage Type
Purchase Money Mortgage
Create a Home Valuation Report for This Property
The Home Valuation Report is an in-depth analysis detailing your home's value as well as a comparison with similar homes in the area
Home Values in the Area
Average Home Value in this Area
Purchase History
| Date | Buyer | Sale Price | Title Company |
|---|---|---|---|
| Singh Tej Kaur | -- | None Available | |
| Singh Tej Kaur | $136,000 | None Available | |
| White Darrell | $140,000 | None Available | |
| Garman Homes Llc | $40,000 | None Available | |
| Zinger Charles R | -- | None Available | |
| Roberts Bryant B | $25,000 | None Available |
Source: Public Records
Mortgage History
| Date | Status | Borrower | Loan Amount |
|---|---|---|---|
| Previous Owner | White Darrell | $137,362 | |
| Previous Owner | Roberts Bryant B | $26,894 |
Source: Public Records
Tax History
| Year | Tax Paid | Tax Assessment Tax Assessment Total Assessment is a certain percentage of the fair market value that is determined by local assessors to be the total taxable value of land and additions on the property. | Land | Improvement |
|---|---|---|---|---|
| 2025 | $1,490 | $300,527 | $61,500 | $239,027 |
| 2024 | $948 | $144,722 | $24,580 | $120,142 |
| 2023 | $948 | $144,722 | $24,580 | $120,142 |
| 2022 | $1,852 | $144,722 | $24,580 | $120,142 |
| 2021 | $1,844 | $144,722 | $24,580 | $120,142 |
| 2020 | $1,800 | $144,722 | $24,580 | $120,142 |
| 2019 | $1,800 | $144,722 | $24,580 | $120,142 |
| 2018 | $1,849 | $136,324 | $24,580 | $111,744 |
| 2017 | $1,535 | $113,975 | $24,580 | $89,395 |
| 2016 | $1,483 | $113,975 | $24,580 | $89,395 |
| 2015 | $2,509 | $181,212 | $21,796 | $159,416 |
| 2014 | $302 | $21,796 | $21,796 | $0 |
Source: Public Records
Map
Nearby Homes
- 3900 Mary Martin Rd
- 3822 Mary Martin Rd
- 913 Valmet Dr
- 914 Flanders Dr
- 608 Chalcedony Ct
- 1005 Sweet Cream Ct
- 7 Duxford Ct
- 1025 Sweet Cream Ct
- 1060 Gentle Reed Dr
- 1113 Homecoming Way
- 1113 Kindness Ln
- 3708 Thornwood Dr
- 507 Lodestone Dr
- 1143 Sweet Cream Ct
- 5409 Hadrian Dr
- 521 Quartz Dr
- 912 Obsidian Way
- 502 Quartz Dr
- 4505 Tyne Dr
- 3511 Thornwood Dr
- 3811 Freeman Rd
- 3813 Freeman Rd
- 3809 Freeman Rd Unit 19
- 3809 Freeman Rd
- 3815 Freeman Rd
- 3817 Freeman Rd
- 3807 Freeman Rd
- 3814 Mary Martin Rd
- 3803 Freeman Rd
- 3819 Freeman Rd
- 3 Onyx Ct
- 3 Onyx Ct
- 3821 Freeman Rd
- 3818 Freeman Rd
- 702 Burrell Rd
- 1 Onyx Ct
- 5 Onyx Ct
- 0 Mary Martin Rd Unit 1784060
- 3802 Mary Martin Rd
- 0 Mary Martin Rd Unit 628724
Your Personal Tour Guide
Ask me questions while you tour the home.