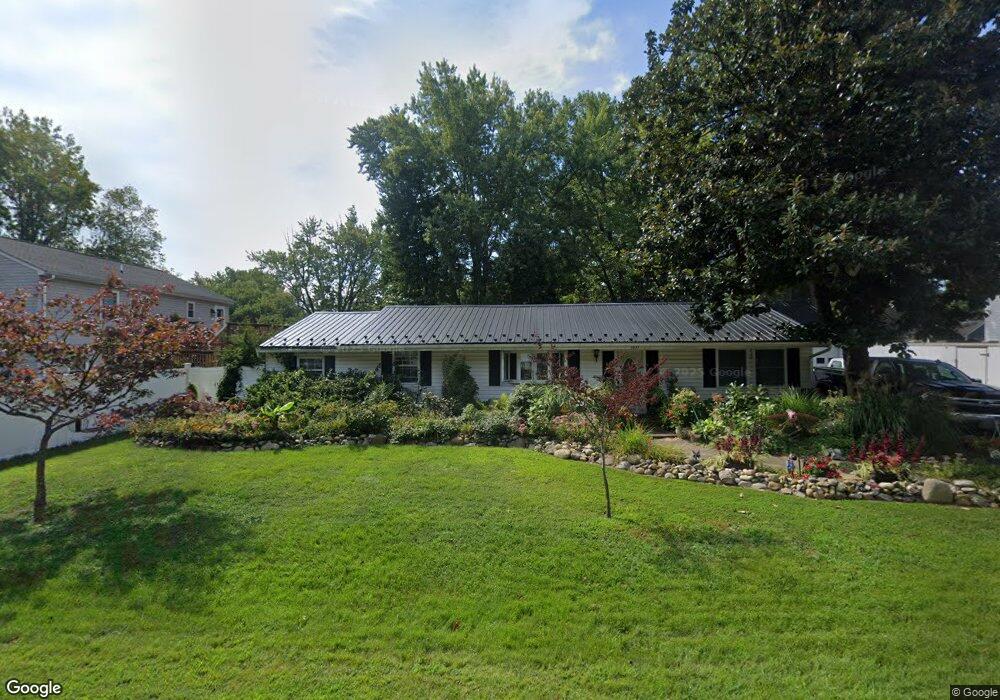
3837 9th St North Beach, MD 20714
Estimated Value: $444,000 - $542,000
About This Home
This home is located at 3837 9th St, North Beach, MD 20714 and is currently estimated at $492,759, approximately $200 per square foot. 3837 9th St is a home located in Calvert County with nearby schools including Windy Hill Elementary School, Windy Hill Middle School, and Northern High School.
Ownership History
We collect this data history from publicly available records. To have your information removed, we recommend requesting removal directly through your county’s website.
Purchase Details
Home Values in the Area
Average Home Value in this Area
Purchase History
We collect this data history from publicly available records. To have your information removed, we recommend requesting removal directly through your county’s website.
| Date | Buyer | Sale Price | Title Company |
|---|---|---|---|
| $69,900 | -- |
Mortgage History
We collect this data history from publicly available records. To have your information removed, we recommend requesting removal directly through your county’s website.
| Date | Status | Borrower | Loan Amount |
|---|---|---|---|
| Closed | $176,149 | ||
| Closed | $50,000 |
Tax History
We collect this data history from publicly available records. To have your information removed, we recommend requesting removal directly through your county’s website.
| Year | Tax Paid | Tax Assessment Tax Assessment Total Assessment is a certain percentage of the fair market value that is determined by local assessors to be the total taxable value of land and additions on the property. | Land | Improvement |
|---|---|---|---|---|
| 2025 | $4,573 | $408,800 | $98,200 | $310,600 |
| 2024 | $4,297 | $383,667 | $0 | $0 |
| 2023 | $3,879 | $358,533 | $0 | $0 |
| 2022 | $3,615 | $333,400 | $98,200 | $235,200 |
| 2021 | $3,484 | $326,633 | $0 | $0 |
| 2020 | $3,484 | $319,867 | $0 | $0 |
| 2019 | $3,426 | $313,100 | $98,200 | $214,900 |
| 2018 | $3,370 | $308,933 | $0 | $0 |
| 2017 | $3,369 | $304,767 | $0 | $0 |
| 2016 | -- | $300,600 | $0 | $0 |
| 2015 | $3,403 | $300,600 | $0 | $0 |
| 2014 | $3,403 | $300,600 | $0 | $0 |
Map
- 3732 8th St
- 9422 Sea Breeze Ct
- 3805 7th St
- 3820 5th St
- 9332 Dayton Ave
- 3641 9th St
- 4032 5th St
- 3614 8th St
- 3781 Bedford Dr
- 3725 Bedford Dr
- 8982 Chesapeake Lighthouse Dr
- 3615 Glouster Dr
- 3610 Glouster Dr
- 9021 Tonyas Terrace
- 3660 Bedford Dr
- 3657 Bedford Dr
- 2811 Glasgow Way
- 9017 Megan Cir
- 700 Maple Ave
- 4013 Seagate Square
Ask me questions while you tour the home.