Estimated Value: $498,000 - $789,000
Studio
--
Bath
938
Sq Ft
$731/Sq Ft
Est. Value
About This Home
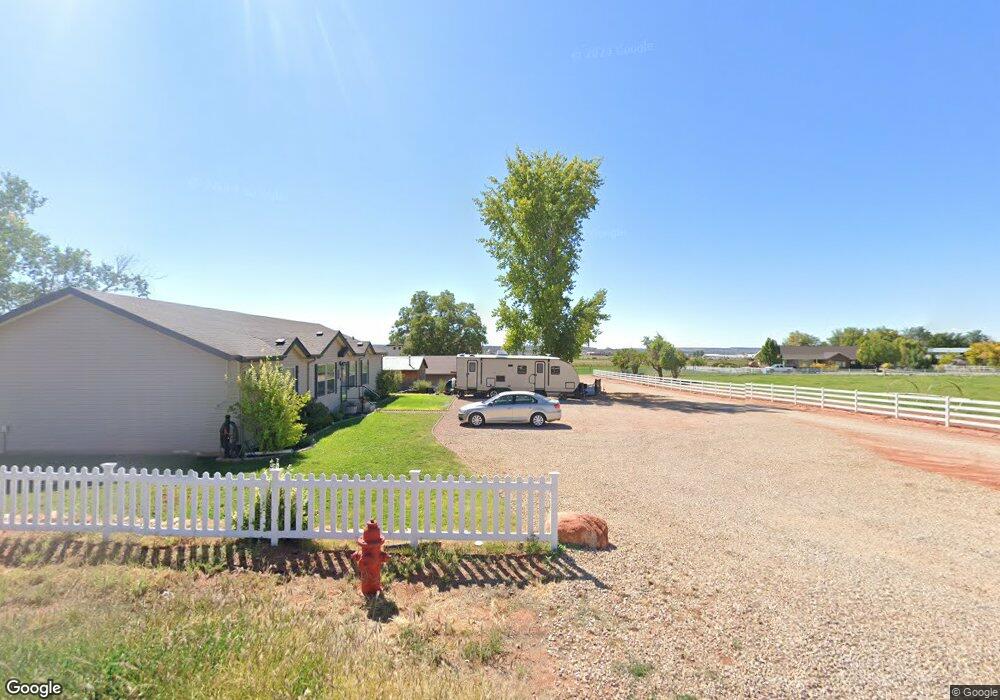
This home is located at 384 E 1100 S, Kanab, UT 84741 and is currently estimated at $686,140, approximately $731 per square foot. 384 E 1100 S is a home located in Kane County with nearby schools including Kanab Elementary School, Kanab Middle School, and Kanab High School.
Ownership History
Date
Name
Owned For
Owner Type
Purchase Details
Closed on
Jan 25, 2016
Sold by
Hutchings Chelsea L and Hutchings Tyson J
Bought by
Perkins Justin and Perkins Chelsea L
Current Estimated Value
Purchase Details
Closed on
Jul 8, 2015
Sold by
Archer Eugene Spencer Archer Eugene Spencer and Swapp Genevieve Cram
Bought by
Perkins Chelsea L and Hutchings Chelsea Lee
Create a Home Valuation Report for This Property
The Home Valuation Report is an in-depth analysis detailing your home's value as well as a comparison with similar homes in the area
Home Values in the Area
Average Home Value in this Area
Purchase History
| Date | Buyer | Sale Price | Title Company |
|---|---|---|---|
| Perkins Justin | -- | -- | |
| Perkins Chelsea L | -- | -- |
Source: Public Records
Tax History
| Year | Tax Paid | Tax Assessment Tax Assessment Total Assessment is a certain percentage of the fair market value that is determined by local assessors to be the total taxable value of land and additions on the property. | Land | Improvement |
|---|---|---|---|---|
| 2025 | $3,994 | $846,469 | $93,325 | $753,144 |
| 2024 | $4,179 | $485,662 | $50,526 | $435,136 |
| 2023 | $3,726 | $443,699 | $48,120 | $395,579 |
| 2022 | $3,364 | $396,632 | $37,015 | $359,617 |
| 2021 | $2,075 | $279,611 | $52,900 | $226,711 |
| 2020 | $948 | $162,906 | $48,700 | $114,206 |
| 2019 | $987 | $165,195 | $45,540 | $119,655 |
| 2018 | $996 | $165,195 | $45,540 | $119,655 |
| 2017 | $949 | $150,246 | $41,400 | $108,846 |
| 2016 | $576 | $88,504 | $41,400 | $47,104 |
| 2015 | $1,272 | $194,220 | $41,400 | $152,820 |
| 2014 | $1,346 | $205,872 | $45,553 | $160,319 |
| 2013 | -- | $53,565 | $0 | $0 |
Source: Public Records
Map
Nearby Homes
- 931 S Hillside Dr
- 818 S Highway 89a
- 275 E 650 S Unit 5
- 80 E Red Shadow Cir
- 611 S 175 E
- 528 S 410 E
- 632 S Hillside Dr
- 476 S 100 E
- 1215 S Kane Dr
- 1117 S Terrel Dr
- 852 E Rocky Rd
- 1449 S Sage Ct
- 0 Chinle Dr
- 1208 S Hamblin Dr
- 0 U S Highway 89
- 1558 E Creekside Dr
- 1558 S East Creekside Dr E
- 325 S Main St
- 380 E 200 S
- 1603 W Creekside Dr
- 384 E 1100 S
- 374 E 1100 S
- 420 E 1100 S
- 1100 S 1100 S S
- 1019 S 10 W
- 379 E 1100 S
- 310 E 1100 S
- 285 E 1100 S
- 349 E 1100 S
- 1175 S Highway 89a
- 1068 E Country Estates Ln
- 1032 E Country Estates Ln
- 1098 E Country Estates Ln
- 1052 E Country Estates Ln
- 1037 E Country Estates Ln
- 1038 E Country Estates Ln
- 650 E 1100 S
- 1946 S Highway 89a
- 1045 S Highway 89a
- 322 E 950 S
Your Personal Tour Guide
Ask me questions while you tour the home.