385 Clark St Unit 1 North Bend, OR 97459
Estimated Value: $243,654 - $268,000
3
Beds
1
Bath
1,000
Sq Ft
$256/Sq Ft
Est. Value
About This Home
This home is located at 385 Clark St Unit 1, North Bend, OR 97459 and is currently estimated at $255,827, approximately $255 per square foot. 385 Clark St Unit 1 is a home located in Coos County with nearby schools including Hillcrest Elementary School, North Bend Middle School, and North Bend Senior High School.
Ownership History
Date
Name
Owned For
Owner Type
Purchase Details
Closed on
Feb 13, 2020
Sold by
Romaneill Rachael L
Bought by
Glock Anthony L and Zweifel Erin J
Current Estimated Value
Home Financials for this Owner
Home Financials are based on the most recent Mortgage that was taken out on this home.
Original Mortgage
$156,565
Outstanding Balance
$138,650
Interest Rate
3.72%
Mortgage Type
New Conventional
Estimated Equity
$117,177
Purchase Details
Closed on
Jan 8, 2019
Sold by
Hanna Jay and Westmark Adam
Bought by
Ramanelli Rachael L
Home Financials for this Owner
Home Financials are based on the most recent Mortgage that was taken out on this home.
Original Mortgage
$137,000
Interest Rate
4.8%
Mortgage Type
New Conventional
Purchase Details
Closed on
Jun 26, 2018
Sold by
Coquille Indian Tribe
Bought by
Hanna Jay and Westmark Adam
Purchase Details
Closed on
Jul 25, 2007
Sold by
Coquille Economic Development Corp
Bought by
Coquille Indian Tribe
Create a Home Valuation Report for This Property
The Home Valuation Report is an in-depth analysis detailing your home's value as well as a comparison with similar homes in the area
Purchase History
| Date | Buyer | Sale Price | Title Company |
|---|---|---|---|
| Glock Anthony L | $155,000 | Ticor Title Co Of Oregon | |
| Ramanelli Rachael L | $147,000 | Ticor Title Co Of Oregon | |
| Hanna Jay | $75,000 | Ticor Title Co | |
| Coquille Indian Tribe | $55,000 | Fidelity National Title Co |
Source: Public Records
Mortgage History
| Date | Status | Borrower | Loan Amount |
|---|---|---|---|
| Open | Glock Anthony L | $156,565 | |
| Previous Owner | Ramanelli Rachael L | $137,000 |
Source: Public Records
Tax History
| Year | Tax Paid | Tax Assessment Tax Assessment Total Assessment is a certain percentage of the fair market value that is determined by local assessors to be the total taxable value of land and additions on the property. | Land | Improvement |
|---|---|---|---|---|
| 2025 | $1,020 | $68,920 | -- | -- |
| 2024 | $1,030 | $66,920 | -- | -- |
| 2023 | $1,000 | $64,980 | $0 | $0 |
| 2022 | $989 | $63,090 | $0 | $0 |
| 2021 | $1,013 | $61,260 | $0 | $0 |
| 2020 | $949 | $61,260 | $0 | $0 |
| 2019 | $908 | $57,750 | $0 | $0 |
| 2018 | $882 | $56,070 | $0 | $0 |
| 2017 | $858 | $54,440 | $0 | $0 |
| 2016 | $832 | $52,860 | $0 | $0 |
| 2015 | $775 | $51,330 | $0 | $0 |
| 2014 | $775 | $49,840 | $0 | $0 |
Source: Public Records
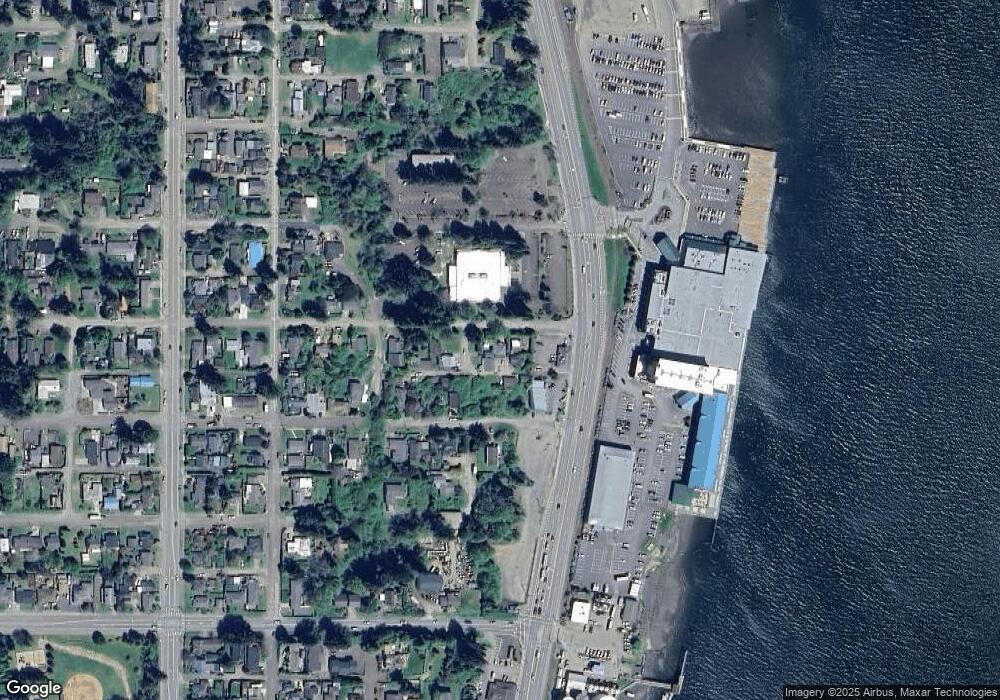
Map
Nearby Homes
- 3236 Sheridan Ave
- 642 Clark St
- 0 Newmark St Unit 190956954
- 3280 Sherman Ave
- 584 Exchange St
- 0 Exchange St
- 00 Exchange St
- 955 State St
- 1092 Lewis St
- 760 Oconnell St
- 353 O'Connell St
- 2517 Liberty St
- 2595 Brussells St
- 3461 Scott Ct
- 2495 Chester St
- 0 Oregon Ave
- 790 Oregon Ave
- 2435 N 10th St
- 2460 Stephanie Ln
- 2453 Stephanie Ln
Your Personal Tour Guide
Ask me questions while you tour the home.