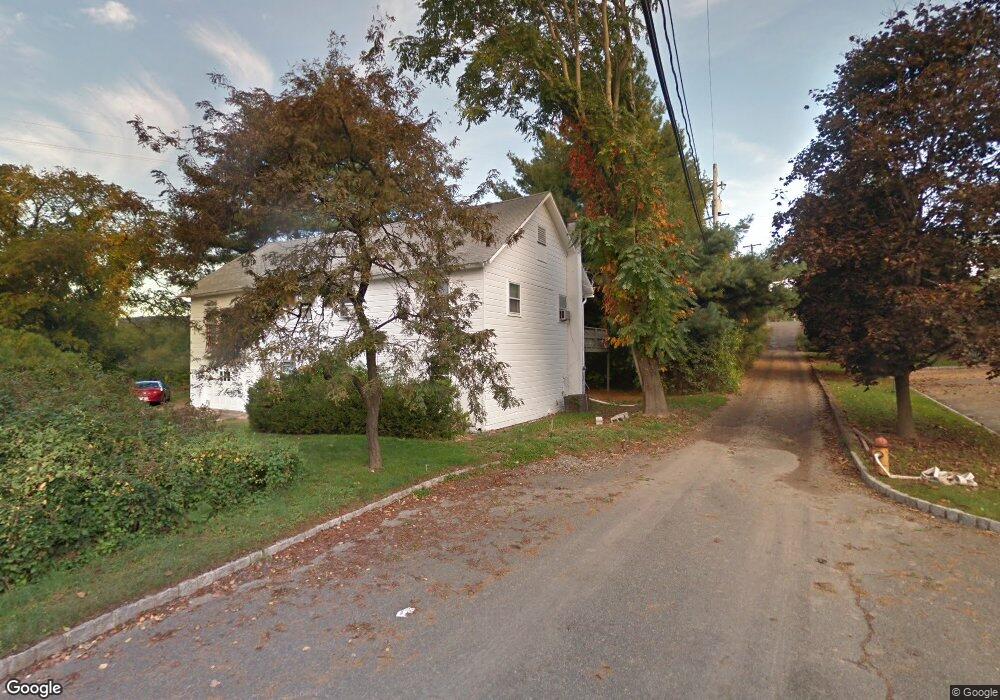
386 Main Rd Montville, NJ 07045
Estimated Value: $645,000 - $838,000
Studio
--
Bath
2,184
Sq Ft
$343/Sq Ft
Est. Value
About This Home
This home is located at 386 Main Rd, Montville, NJ 07045 and is currently estimated at $748,667, approximately $342 per square foot. 386 Main Rd is a home with nearby schools including Montville Township High School, Apple Montessori School of Towaco, and Trinity Christian School.
Ownership History
Date
Name
Owned For
Owner Type
Purchase Details
Closed on
Mar 8, 2007
Sold by
384 386 Main Road Realty Llc
Bought by
Wb Developers Llc
Current Estimated Value
Home Financials for this Owner
Home Financials are based on the most recent Mortgage that was taken out on this home.
Original Mortgage
$720,000
Outstanding Balance
$437,473
Interest Rate
6.33%
Mortgage Type
Purchase Money Mortgage
Estimated Equity
$311,194
Purchase Details
Closed on
Aug 14, 2000
Sold by
Vreeland Allen F and Vreeland Deena
Bought by
384-386 Main Road Realty Llc
Home Financials for this Owner
Home Financials are based on the most recent Mortgage that was taken out on this home.
Original Mortgage
$335,000
Interest Rate
9.5%
Create a Home Valuation Report for This Property
The Home Valuation Report is an in-depth analysis detailing your home's value as well as a comparison with similar homes in the area
Home Values in the Area
Average Home Value in this Area
Purchase History
| Date | Buyer | Sale Price | Title Company |
|---|---|---|---|
| Wb Developers Llc | $495,000 | -- | |
| 384-386 Main Road Realty Llc | $250,000 | -- |
Source: Public Records
Mortgage History
| Date | Status | Borrower | Loan Amount |
|---|---|---|---|
| Open | Wb Developers Llc | $720,000 | |
| Previous Owner | 384-386 Main Road Realty Llc | $335,000 |
Source: Public Records
Tax History
| Year | Tax Paid | Tax Assessment Tax Assessment Total Assessment is a certain percentage of the fair market value that is determined by local assessors to be the total taxable value of land and additions on the property. | Land | Improvement |
|---|---|---|---|---|
| 2025 | $13,015 | $490,400 | $239,000 | $251,400 |
| 2024 | $12,741 | $490,400 | $239,000 | $251,400 |
| 2023 | $12,741 | $490,400 | $239,000 | $251,400 |
| 2022 | $12,353 | $490,400 | $239,000 | $251,400 |
| 2021 | $12,353 | $490,400 | $239,000 | $251,400 |
| 2020 | $12,103 | $490,400 | $239,000 | $251,400 |
| 2019 | $11,887 | $490,400 | $239,000 | $251,400 |
| 2018 | $11,784 | $490,400 | $239,000 | $251,400 |
| 2017 | $11,480 | $490,400 | $239,000 | $251,400 |
| 2016 | $11,235 | $490,400 | $239,000 | $251,400 |
| 2015 | $11,059 | $490,400 | $239,000 | $251,400 |
| 2014 | $10,911 | $490,400 | $239,000 | $251,400 |
Source: Public Records
Map
Nearby Homes
- 18 Cable Ct Unit 48
- 18 Cable Ct
- 16 Cable Ct
- 29 Schneider Ln
- 20 Encampment Ct U210 Unit 210
- 107 Encampment Ct
- 310 Encampment Ct
- 204 Encampment Ct
- 206 Encampment Ct
- 201 Encampment Ct
- 47 Abbott Rd
- 75 Washington Ct
- 20 Unit 211
- 41 Lakeview Terrace Unit 222
- 34 Kanouse Ln
- 27 Cobblestone Terrace Unit 242
- 35 Millers Ln
- 18 Valhalla Rd
- 53 Ridge Dr
- 6 Rathbun Rd
Your Personal Tour Guide
Ask me questions while you tour the home.