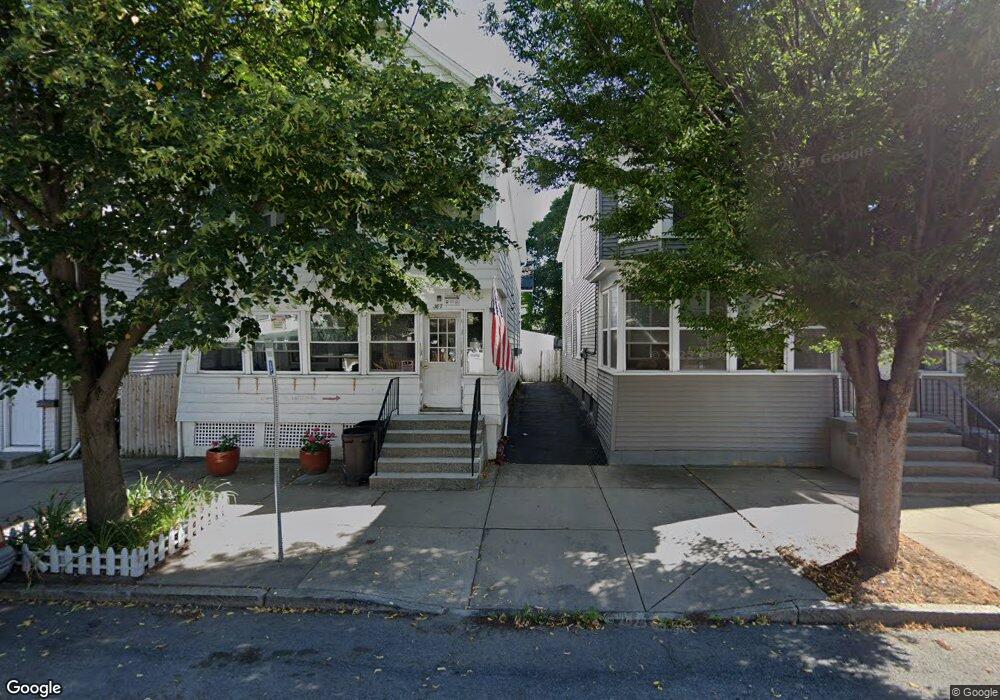
389 3rd St Albany, NY 12206
West Hill NeighborhoodEstimated Value: $120,000 - $212,000
6
Beds
2
Baths
2,200
Sq Ft
$76/Sq Ft
Est. Value
About This Home
This home is located at 389 3rd St, Albany, NY 12206 and is currently estimated at $166,126, approximately $75 per square foot. 389 3rd St is a home located in Albany County with nearby schools including Stephen And Harriet Myers Middle School, Roots Academy at West Hill, and Albany High School.
Ownership History
Date
Name
Owned For
Owner Type
Purchase Details
Closed on
Feb 17, 2012
Sold by
Anderson Zachariah
Bought by
Berberena Judy
Current Estimated Value
Home Financials for this Owner
Home Financials are based on the most recent Mortgage that was taken out on this home.
Original Mortgage
$57,016
Outstanding Balance
$39,304
Interest Rate
4.4%
Mortgage Type
FHA
Estimated Equity
$126,822
Purchase Details
Closed on
Mar 2, 1999
Sold by
Tehrani Haji M
Bought by
Rivera Audeliz
Home Financials for this Owner
Home Financials are based on the most recent Mortgage that was taken out on this home.
Original Mortgage
$46,200
Interest Rate
6.73%
Mortgage Type
FHA
Create a Home Valuation Report for This Property
The Home Valuation Report is an in-depth analysis detailing your home's value as well as a comparison with similar homes in the area
Home Values in the Area
Average Home Value in this Area
Purchase History
| Date | Buyer | Sale Price | Title Company |
|---|---|---|---|
| Berberena Judy | $58,500 | None Available | |
| Rivera Audeliz | $39,000 | -- |
Source: Public Records
Mortgage History
| Date | Status | Borrower | Loan Amount |
|---|---|---|---|
| Open | Berberena Judy | $57,016 | |
| Previous Owner | Rivera Audeliz | $46,200 |
Source: Public Records
Tax History
| Year | Tax Paid | Tax Assessment Tax Assessment Total Assessment is a certain percentage of the fair market value that is determined by local assessors to be the total taxable value of land and additions on the property. | Land | Improvement |
|---|---|---|---|---|
| 2025 | $477 | $109,000 | $21,800 | $87,200 |
| 2024 | $477 | $109,000 | $21,800 | $87,200 |
| 2023 | $423 | $63,000 | $12,600 | $50,400 |
| 2022 | $199 | $63,000 | $12,600 | $50,400 |
| 2021 | $196 | $63,000 | $12,600 | $50,400 |
| 2020 | $190 | $63,000 | $12,600 | $50,400 |
| 2019 | $619 | $63,000 | $12,600 | $50,400 |
| 2018 | $190 | $63,000 | $12,600 | $50,400 |
| 2017 | $191 | $63,000 | $12,600 | $50,400 |
| 2016 | $189 | $63,000 | $12,600 | $50,400 |
| 2015 | $187 | $62,800 | $12,600 | $50,200 |
| 2014 | -- | $62,800 | $12,600 | $50,200 |
Source: Public Records
Map
Nearby Homes
Your Personal Tour Guide
Ask me questions while you tour the home.