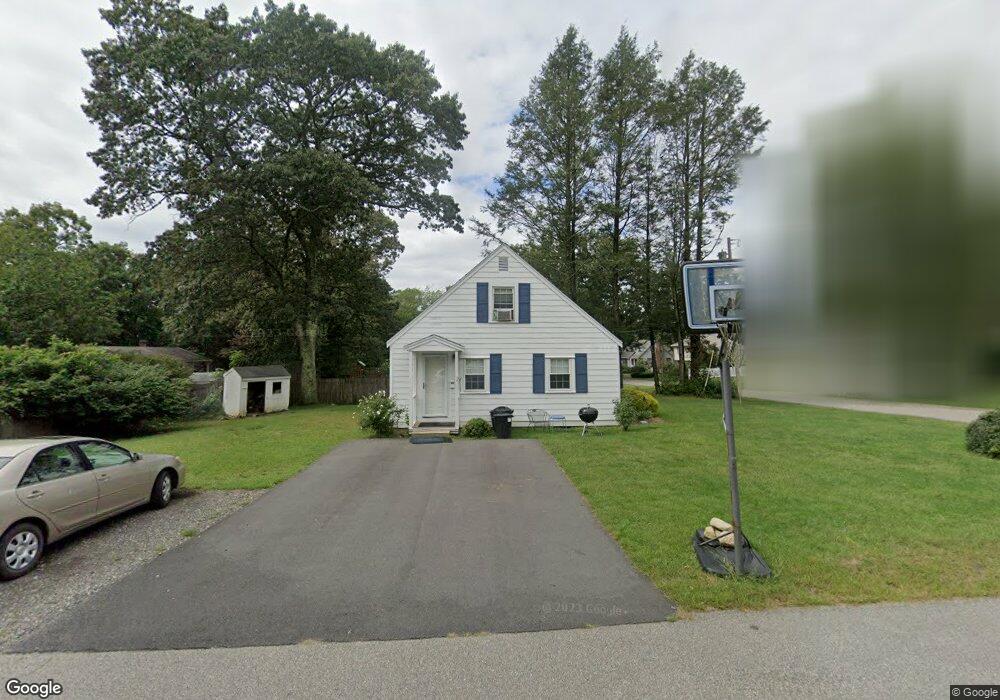
39 Benny St Walpole, MA 02081
Estimated Value: $480,000 - $646,000
2
Beds
1
Bath
1,190
Sq Ft
$477/Sq Ft
Est. Value
About This Home
This home is located at 39 Benny St, Walpole, MA 02081 and is currently estimated at $567,683, approximately $477 per square foot. 39 Benny St is a home located in Norfolk County with nearby schools including Old Post Road School, Walpole Middle School, and Walpole High School.
Ownership History
Date
Name
Owned For
Owner Type
Purchase Details
Closed on
Jul 21, 1995
Sold by
Freedman June M
Bought by
Springer Jan R and Springer Lisa A
Current Estimated Value
Home Financials for this Owner
Home Financials are based on the most recent Mortgage that was taken out on this home.
Original Mortgage
$111,500
Interest Rate
7.49%
Mortgage Type
Purchase Money Mortgage
Create a Home Valuation Report for This Property
The Home Valuation Report is an in-depth analysis detailing your home's value as well as a comparison with similar homes in the area
Home Values in the Area
Average Home Value in this Area
Purchase History
| Date | Buyer | Sale Price | Title Company |
|---|---|---|---|
| Springer Jan R | $117,406 | -- |
Source: Public Records
Mortgage History
| Date | Status | Borrower | Loan Amount |
|---|---|---|---|
| Closed | Springer Jan R | $111,500 |
Source: Public Records
Tax History
| Year | Tax Paid | Tax Assessment Tax Assessment Total Assessment is a certain percentage of the fair market value that is determined by local assessors to be the total taxable value of land and additions on the property. | Land | Improvement |
|---|---|---|---|---|
| 2025 | $5,936 | $462,700 | $284,400 | $178,300 |
| 2024 | $5,781 | $437,300 | $273,400 | $163,900 |
| 2023 | $5,655 | $407,100 | $237,700 | $169,400 |
| 2022 | $5,359 | $370,600 | $220,100 | $150,500 |
| 2021 | $5,052 | $340,400 | $207,700 | $132,700 |
| 2020 | $5,089 | $339,500 | $195,900 | $143,600 |
| 2019 | $4,914 | $325,400 | $188,400 | $137,000 |
| 2018 | $4,488 | $293,900 | $181,000 | $112,900 |
| 2017 | $4,337 | $282,900 | $174,000 | $108,900 |
| 2016 | $4,234 | $272,100 | $167,300 | $104,800 |
| 2015 | $4,079 | $259,800 | $158,900 | $100,900 |
| 2014 | $3,954 | $250,900 | $158,900 | $92,000 |
Source: Public Records
Map
Nearby Homes
- 86 Alton St
- 9 Rainbow Pond Dr Unit 6
- 23 Rainbow Pond Dr Unit D1
- 40 Neal St
- 700 East St Unit L
- 1 Providence Hwy
- 1 Palace Ct
- 2 Kendall St
- 12 Sawmill Rd
- 1108 Pennington Dr Unit 1108
- 2301 Pennington Dr Unit 2301
- 24 Gristmill Ln
- 65-67 Diamond St
- 131 Carpenter Rd
- 363 - 367 Washington St
- 120 Polley Ln
- 222 School St Unit 9
- 635 Old Post Rd Unit 303
- 635 Old Post Rd Unit 2-209
- 635 Old Post Rd Unit 302
Your Personal Tour Guide
Ask me questions while you tour the home.