39 Birch St Abington, MA 02351
Estimated Value: $571,000 - $631,000
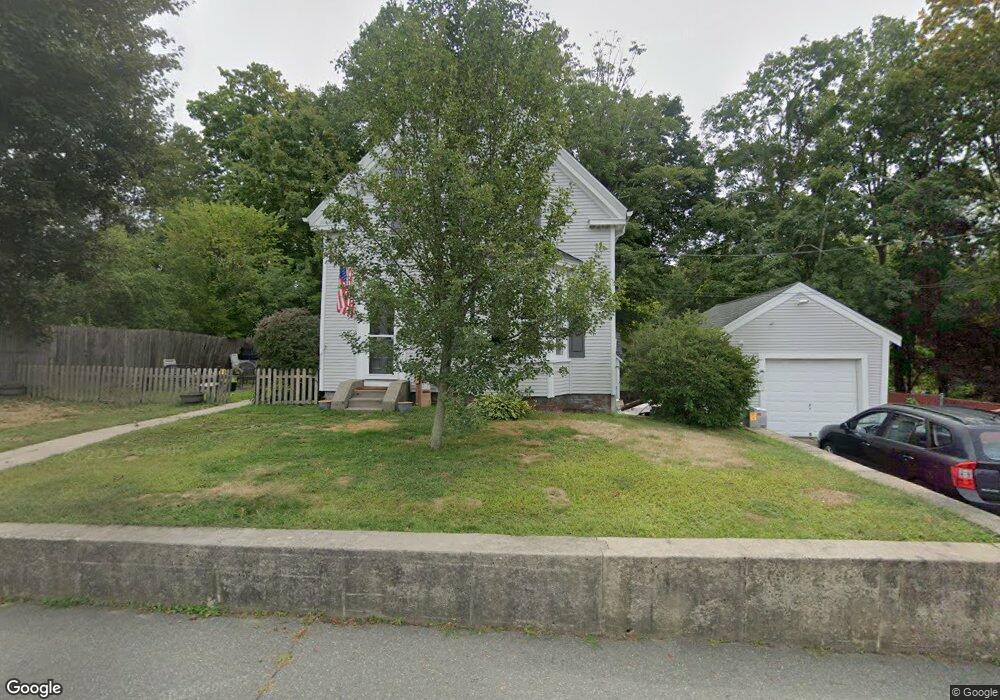
About This Home
This home is located at 39 Birch St, Abington, MA 02351 and is currently estimated at $596,046, approximately $414 per square foot. 39 Birch St is a home located in Plymouth County with nearby schools including Beaver Brook Elementary School, Abington Middle School, and Woodsdale School.
Ownership History
We collect this data history from publicly available records. To have your information removed, we recommend requesting removal directly through your county’s website.
Purchase Details
Purchase Details
Home Financials for this Owner
Home Financials are based on the most recent Mortgage that was taken out on this home.Home Values in the Area
Average Home Value in this Area
Purchase History
We collect this data history from publicly available records. To have your information removed, we recommend requesting removal directly through your county’s website.
| Date | Buyer | Sale Price | Title Company |
|---|---|---|---|
| -- | -- | ||
| $239,000 | -- |
Mortgage History
We collect this data history from publicly available records. To have your information removed, we recommend requesting removal directly through your county’s website.
| Date | Status | Borrower | Loan Amount |
|---|---|---|---|
| Previous Owner | $267,750 | ||
| Previous Owner | $196,200 | ||
| Previous Owner | $194,068 | ||
| Previous Owner | $67,000 |
Tax History
We collect this data history from publicly available records. To have your information removed, we recommend requesting removal directly through your county’s website.
| Year | Tax Paid | Tax Assessment Tax Assessment Total Assessment is a certain percentage of the fair market value that is determined by local assessors to be the total taxable value of land and additions on the property. | Land | Improvement |
|---|---|---|---|---|
| 2025 | $6,482 | $496,300 | $240,400 | $255,900 |
| 2024 | $6,392 | $477,700 | $218,700 | $259,000 |
| 2023 | $6,341 | $446,200 | $190,300 | $255,900 |
| 2022 | $6,126 | $402,500 | $166,700 | $235,800 |
| 2021 | $5,730 | $345,200 | $151,300 | $193,900 |
| 2020 | $5,790 | $340,600 | $146,700 | $193,900 |
| 2019 | $5,462 | $314,100 | $139,800 | $174,300 |
| 2018 | $5,376 | $301,700 | $139,800 | $161,900 |
| 2017 | $5,118 | $278,900 | $139,800 | $139,100 |
| 2016 | $5,035 | $280,800 | $133,200 | $147,600 |
| 2015 | $4,655 | $273,800 | $133,200 | $140,600 |
Map
- 20 Cleverly St Unit A4
- 82 & 84 Railroad St
- 60 Pattison St Unit 17
- 33 Brookline St
- 57 Battery St
- 490 North Ave
- 1065 Bedford St
- 575 Salem St
- 96 Central St
- 364 North Ave
- 113 Colonel Hunt Dr
- 1148 Bedford St
- 22 Brookside Rd
- 460 Salem St
- 251 Central St
- 1907 Thayer St
- 416 Thayer St Unit 416
- 383 Salem St
- 4 Birch St
- 181 Central St
Ask me questions while you tour the home.