Estimated Value: $128,000 - $220,000
2
Beds
2
Baths
1,184
Sq Ft
$135/Sq Ft
Est. Value
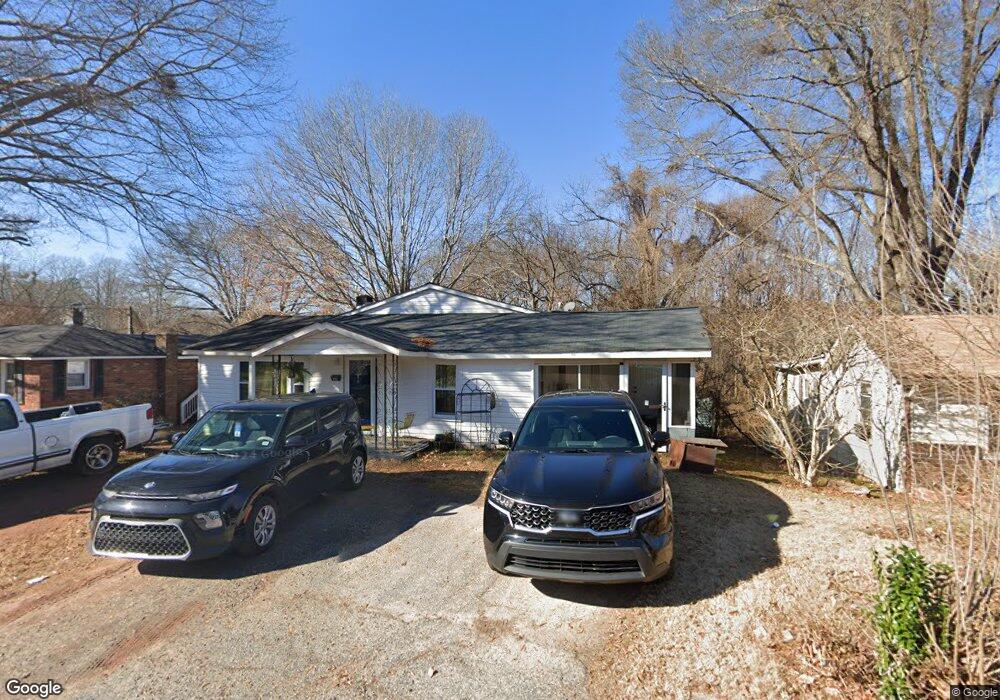
About This Home
This home is located at 39 Bobo St, Inman, SC 29349 and is currently estimated at $159,271, approximately $134 per square foot. 39 Bobo St is a home located in Spartanburg County with nearby schools including Inman Elementary School, T.E. Mabry Middle School, and Chapman High School.
Ownership History
Date
Name
Owned For
Owner Type
Purchase Details
Closed on
May 3, 2022
Sold by
J & W Upstate Holdings Llc
Bought by
Conner Robin Staggs
Current Estimated Value
Purchase Details
Closed on
Apr 15, 2013
Sold by
Grooms John
Bought by
J & W Upstate Holdings Llc
Purchase Details
Closed on
Jan 22, 2013
Sold by
City Of Inman
Bought by
Grooms John
Purchase Details
Closed on
Sep 21, 2009
Sold by
Lister Paul D
Bought by
City Of Inman
Purchase Details
Closed on
Dec 9, 2004
Sold by
Hines Daisey Foster
Bought by
Lister Paul D
Create a Home Valuation Report for This Property
The Home Valuation Report is an in-depth analysis detailing your home's value as well as a comparison with similar homes in the area
Home Values in the Area
Average Home Value in this Area
Purchase History
We collect this data history from publicly available records. To have your information removed, we recommend requesting removal directly through your county’s website.
| Date | Buyer | Sale Price | Title Company |
|---|---|---|---|
| Conner Robin Staggs | $1,000 | None Listed On Document | |
| Conner Robin Staggs | $1,000 | None Listed On Document | |
| J & W Upstate Holdings Llc | -- | -- | |
| Grooms John | $6,701 | -- | |
| City Of Inman | -- | -- | |
| Lister Paul D | $4,600 | -- |
Source: Public Records
Tax History
| Year | Tax Paid | Tax Assessment Tax Assessment Total Assessment is a certain percentage of the fair market value that is determined by local assessors to be the total taxable value of land and additions on the property. | Land | Improvement |
|---|---|---|---|---|
| 2025 | $2,050 | $4,326 | $906 | $3,420 |
| 2024 | $2,050 | $4,326 | $906 | $3,420 |
| 2023 | $2,050 | $4,326 | $906 | $3,420 |
| 2022 | $1,121 | $2,229 | $273 | $1,956 |
| 2021 | $1,110 | $2,229 | $273 | $1,956 |
| 2020 | $1,093 | $2,229 | $273 | $1,956 |
| 2019 | $1,100 | $2,229 | $273 | $1,956 |
| 2018 | $1,093 | $2,229 | $273 | $1,956 |
| 2017 | $939 | $1,938 | $300 | $1,638 |
| 2016 | $924 | $1,938 | $300 | $1,638 |
| 2015 | $919 | $1,938 | $300 | $1,638 |
| 2014 | $1,148 | $2,502 | $600 | $1,902 |
Source: Public Records
Map
Nearby Homes
- 64 Bobo St
- 72 Bobo St
- 212 Johnson Hills Dr
- 7 Lawrence St
- 14 Culbreth St Unit 16
- 5 Pine Ln
- 30 Bridges St
- 3 Littlejohn St
- 3139 Lorenzo Ct
- 15 Littlejohn St
- 193 State Road S-42-1795
- 3127 Lorenzo Ct
- 26 Blackstock Rd
- 64 E Main St
- 84 N Main St
- 11031 Asheville Hwy
- 21 Henderson St
- 221 N Main St
- 23 Jordan St
- 0 Bishop Rd
Your Personal Tour Guide
Ask me questions while you tour the home.