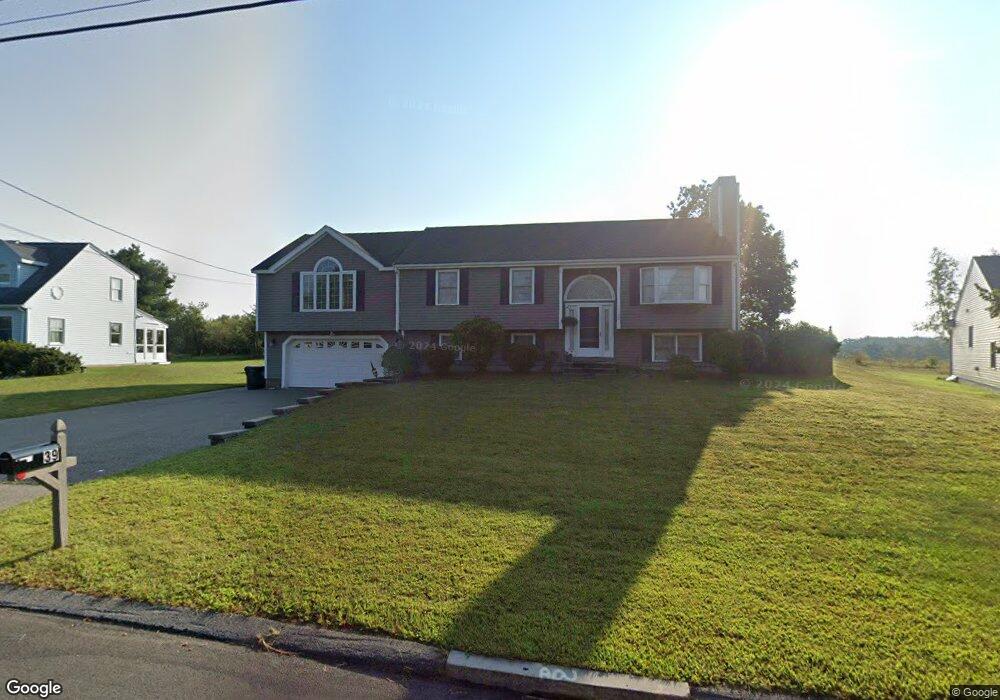
39 Brion Rd Bellingham, MA 02019
Estimated Value: $574,000 - $712,000
3
Beds
2
Baths
2,677
Sq Ft
$236/Sq Ft
Est. Value
About This Home
This home is located at 39 Brion Rd, Bellingham, MA 02019 and is currently estimated at $631,548, approximately $235 per square foot. 39 Brion Rd is a home located in Norfolk County with nearby schools including Joseph F. DiPietro Elementary, Bellingham High School, and Bethany Christian Academy.
Ownership History
Date
Name
Owned For
Owner Type
Purchase Details
Closed on
Oct 16, 2024
Sold by
Robidoux Joseph E and Robidoux Susan E
Bought by
2024 Robidoux Ft and Robidoux
Current Estimated Value
Purchase Details
Closed on
Apr 9, 1990
Sold by
Silver Hgts Dev Cor
Bought by
Robidoux Joseph E
Create a Home Valuation Report for This Property
The Home Valuation Report is an in-depth analysis detailing your home's value as well as a comparison with similar homes in the area
Home Values in the Area
Average Home Value in this Area
Purchase History
We collect this data history from publicly available records. To have your information removed, we recommend requesting removal directly through your county’s website.
| Date | Buyer | Sale Price | Title Company |
|---|---|---|---|
| 2024 Robidoux Ft | -- | None Available | |
| 2024 Robidoux Ft | -- | None Available | |
| Robidoux Joseph E | $129,750 | -- | |
| Robidoux Joseph E | $129,750 | -- |
Source: Public Records
Mortgage History
We collect this data history from publicly available records. To have your information removed, we recommend requesting removal directly through your county’s website.
| Date | Status | Borrower | Loan Amount |
|---|---|---|---|
| Previous Owner | Robidoux Joseph E | $147,000 | |
| Previous Owner | Robidoux Joseph E | $156,500 | |
| Previous Owner | Robidoux Joseph E | $112,000 |
Source: Public Records
Tax History
| Year | Tax Paid | Tax Assessment Tax Assessment Total Assessment is a certain percentage of the fair market value that is determined by local assessors to be the total taxable value of land and additions on the property. | Land | Improvement |
|---|---|---|---|---|
| 2025 | $6,481 | $516,000 | $165,000 | $351,000 |
| 2024 | $6,204 | $482,400 | $150,700 | $331,700 |
| 2023 | $5,978 | $458,100 | $143,500 | $314,600 |
| 2022 | $5,866 | $416,600 | $119,600 | $297,000 |
| 2021 | $5,665 | $393,100 | $119,600 | $273,500 |
| 2020 | $5,435 | $382,200 | $119,600 | $262,600 |
| 2019 | $5,312 | $373,800 | $119,600 | $254,200 |
| 2018 | $4,958 | $344,100 | $115,000 | $229,100 |
| 2017 | $4,804 | $335,000 | $115,000 | $220,000 |
| 2016 | $4,581 | $320,600 | $113,100 | $207,500 |
| 2015 | $4,389 | $308,000 | $108,800 | $199,200 |
| 2014 | $4,404 | $300,400 | $106,300 | $194,100 |
Source: Public Records
Map
Nearby Homes
- 975 S Main St
- 1003 Old Bridge Ln Unit 1003
- 7 Debra Ln Unit 1
- 1804 Old Bridge Ln Unit 1804
- 1110 S Main St
- 3002 Maple Brook Rd Unit 3002
- 0 North St Unit 73440626
- 3301 Maple Brook Rd
- 1 Whitman Cir Unit 1
- 3 Whitman Cir Unit 3
- 13 Whitman Cir Unit 13
- 142 Bellwood Cir Unit 142
- 250 Prospect St
- 241 Prospect St
- 38 Country Side Rd
- 1 Toni Dr
- 123-125 Mendon St
- 85 Mendon St
- 39 Whitehall Way
- 36 Indian Run Rd
Your Personal Tour Guide
Ask me questions while you tour the home.