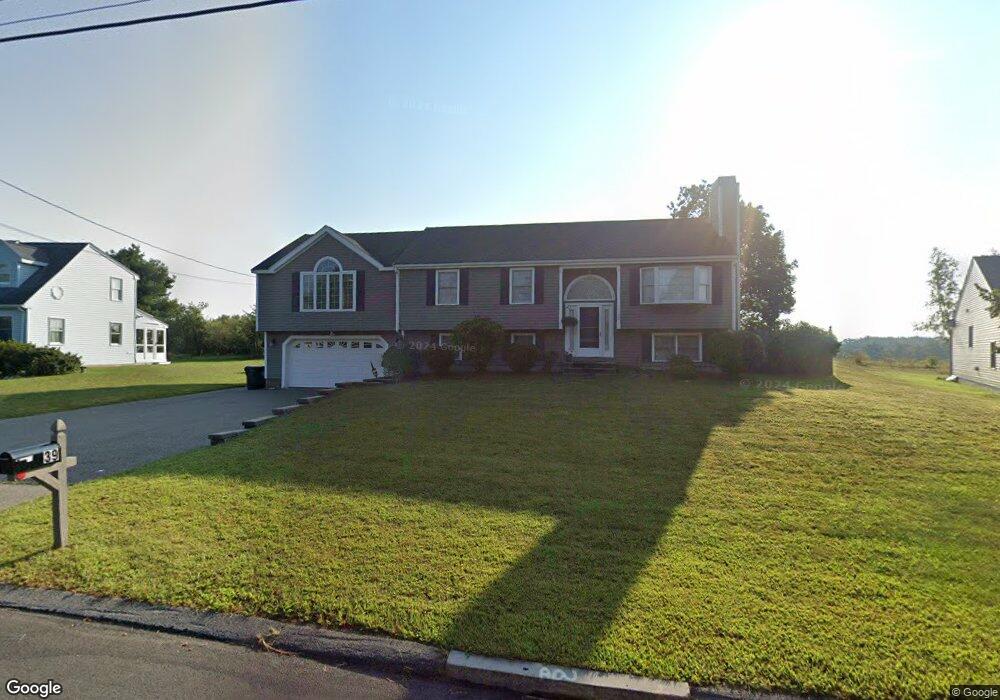
39 Brion Rd Bellingham, MA 02019
Estimated Value: $633,000 - $727,000
About This Home
This home is located at 39 Brion Rd, Bellingham, MA 02019 and is currently estimated at $657,941, approximately $245 per square foot. 39 Brion Rd is a home located in Norfolk County with nearby schools including Joseph F. DiPietro Elementary, Bellingham High School, and Bethany Christian Academy.
Ownership History
We collect this data history from publicly available records. To have your information removed, we recommend requesting removal directly through your county’s website.
Purchase Details
Purchase Details
Home Values in the Area
Average Home Value in this Area
Purchase History
We collect this data history from publicly available records. To have your information removed, we recommend requesting removal directly through your county’s website.
| Date | Buyer | Sale Price | Title Company |
|---|---|---|---|
| -- | None Available | ||
| $129,750 | -- |
Mortgage History
We collect this data history from publicly available records. To have your information removed, we recommend requesting removal directly through your county’s website.
| Date | Status | Borrower | Loan Amount |
|---|---|---|---|
| Closed | $151,695 | ||
| Closed | $50,000 | ||
| Closed | $147,000 | ||
| Closed | $156,500 | ||
| Closed | $150,100 | ||
| Closed | $154,500 | ||
| Closed | $133,000 |
Tax History
We collect this data history from publicly available records. To have your information removed, we recommend requesting removal directly through your county’s website.
| Year | Tax Paid | Tax Assessment Tax Assessment Total Assessment is a certain percentage of the fair market value that is determined by local assessors to be the total taxable value of land and additions on the property. | Land | Improvement |
|---|---|---|---|---|
| 2025 | $6,481 | $516,000 | $165,000 | $351,000 |
| 2024 | $6,204 | $482,400 | $150,700 | $331,700 |
| 2023 | $5,978 | $458,100 | $143,500 | $314,600 |
| 2022 | $5,866 | $416,600 | $119,600 | $297,000 |
| 2021 | $5,665 | $393,100 | $119,600 | $273,500 |
| 2020 | $5,435 | $382,200 | $119,600 | $262,600 |
| 2019 | $5,312 | $373,800 | $119,600 | $254,200 |
| 2018 | $4,958 | $344,100 | $115,000 | $229,100 |
| 2017 | $4,804 | $335,000 | $115,000 | $220,000 |
| 2016 | $4,581 | $320,600 | $113,100 | $207,500 |
| 2015 | $4,389 | $308,000 | $108,800 | $199,200 |
| 2014 | $4,404 | $300,400 | $106,300 | $194,100 |
Map
- 4 Candlelight Ln
- 49 Lakeview Ave
- 1003 Old Bridge Ln Unit 1003
- 9 Debra Ln Unit 1
- 11 Lilac Ave
- 2503 Old Bridge Ln Unit 2503
- 628 Maple Brook Rd Unit 628
- 640 Maple Brook Rd
- 3002 Maple Brook Rd Unit 3002
- 218 Blackstone St
- 0 North St Unit 73440626
- 62 North St
- 1 Whitman Cir Unit 1
- 3 Whitman Cir Unit 3
- 7 Whitman Cir Unit 7
- 241 Prospect St
- 38 Country Side Rd
- 123 Bellwood Cir Unit 123
- 2 Depoto Dr
- 61 Scott Hill Blvd
Ask me questions while you tour the home.