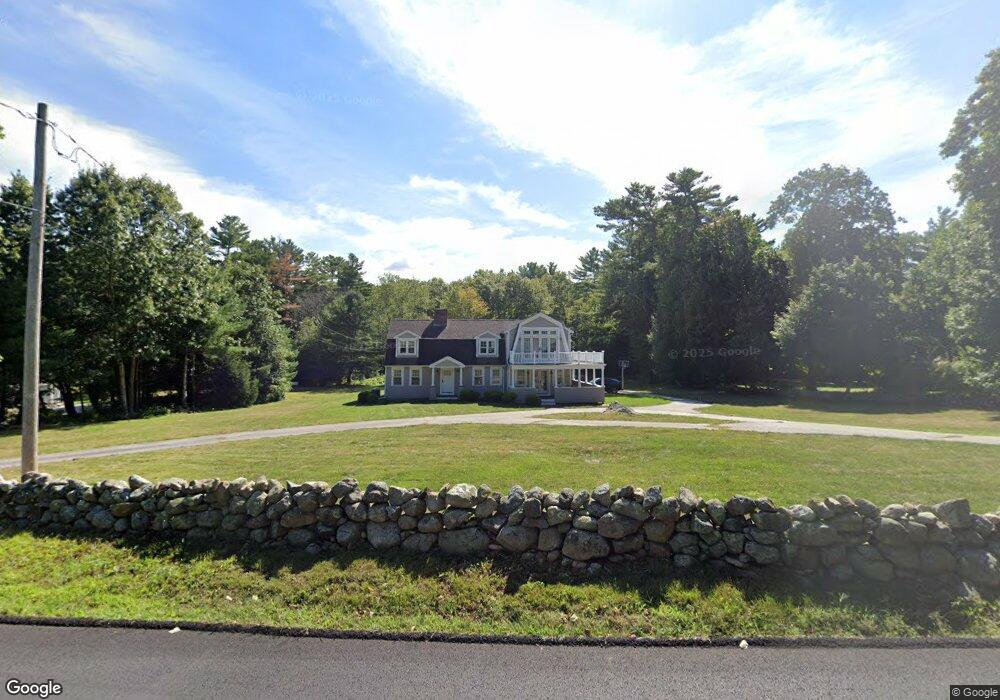
39 Cross St Norwell, MA 02061
Estimated Value: $1,067,000 - $1,316,000
About This Home
This home is located at 39 Cross St, Norwell, MA 02061 and is currently estimated at $1,219,281, approximately $649 per square foot. 39 Cross St is a home located in Plymouth County with nearby schools including William Gould Vinal, Norwell Middle School, and Norwell High School.
Ownership History
We collect this data history from publicly available records. To have your information removed, we recommend requesting removal directly through your county’s website.
Purchase Details
Purchase Details
Home Values in the Area
Average Home Value in this Area
Purchase History
We collect this data history from publicly available records. To have your information removed, we recommend requesting removal directly through your county’s website.
| Date | Buyer | Sale Price | Title Company |
|---|---|---|---|
| $317,000 | -- | ||
| $317,000 | -- | ||
| $214,900 | -- | ||
| $214,900 | -- |
Mortgage History
We collect this data history from publicly available records. To have your information removed, we recommend requesting removal directly through your county’s website.
| Date | Status | Borrower | Loan Amount |
|---|---|---|---|
| Open | $417,000 |
Tax History
We collect this data history from publicly available records. To have your information removed, we recommend requesting removal directly through your county’s website.
| Year | Tax Paid | Tax Assessment Tax Assessment Total Assessment is a certain percentage of the fair market value that is determined by local assessors to be the total taxable value of land and additions on the property. | Land | Improvement |
|---|---|---|---|---|
| 2025 | $14,391 | $1,101,100 | $399,700 | $701,400 |
| 2024 | $13,780 | $1,023,800 | $377,200 | $646,600 |
| 2023 | $13,729 | $897,900 | $290,100 | $607,800 |
| 2022 | $13,143 | $790,800 | $252,600 | $538,200 |
| 2021 | $4,609 | $734,000 | $265,700 | $468,300 |
| 2020 | $3,644 | $716,100 | $265,700 | $450,400 |
| 2019 | $11,275 | $687,500 | $265,700 | $421,800 |
| 2018 | $10,943 | $669,700 | $265,700 | $404,000 |
| 2017 | $11,035 | $670,800 | $265,700 | $405,100 |
| 2016 | $10,689 | $647,800 | $265,700 | $382,100 |
| 2015 | $10,430 | $632,100 | $265,700 | $366,400 |
| 2014 | $9,609 | $587,000 | $264,700 | $322,300 |
Map
- 20 Walnut Hill Dr
- 17 Old Meeting House Ln
- 161 Cross St
- 54 Old Meeting House Ln
- 47 Fords Crossing
- 10 Dunster Ln
- 95 Stony Brook Ln
- 252 Winter St
- 5 Webster Farm Way
- 3 Webster Farm Way
- 20 Webster Farm Way
- 6 Webster Farm Way
- 85 Kings Landing
- 334 Chief Justice Cushing Hwy
- 26 Neal Gate St
- 102 Riverside Cir
- 908 Main St
- 8 Bridge St
- 15 May Elm Ln
- 131 Maple St
Ask me questions while you tour the home.