39 E 900 S Santaquin, UT 84655
Estimated Value: $543,500
4
Beds
1
Bath
1,959
Sq Ft
$277/Sq Ft
Est. Value
About This Home
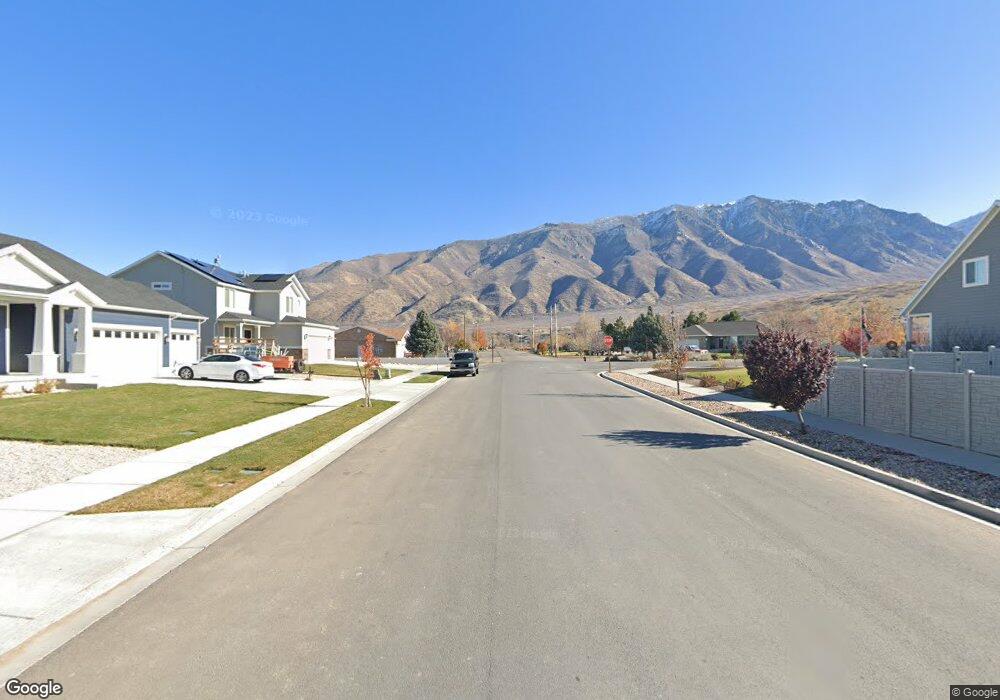
This home is located at 39 E 900 S, Santaquin, UT 84655 and is currently priced at $543,500, approximately $277 per square foot. 39 E 900 S is a home located in Utah County with nearby schools including Orchard Hills Elementary School, Payson Junior High School, and Mt. Nebo Middle.
Ownership History
Date
Name
Owned For
Owner Type
Purchase Details
Closed on
Apr 10, 2023
Sold by
Provstgaard Bart J and Provstgaard Stacy L
Bought by
Bart And Stacy Provstgaard Living Trust and Provstgaard
Current Estimated Value
Purchase Details
Closed on
Jan 25, 2013
Sold by
Provstgaard Bart Jay and Provstgaard Stacy Lynn
Bought by
Provstgaard Bart J and Provstgaard Stacy L
Home Financials for this Owner
Home Financials are based on the most recent Mortgage that was taken out on this home.
Original Mortgage
$145,000
Interest Rate
3.33%
Mortgage Type
New Conventional
Purchase Details
Closed on
Nov 12, 1999
Sold by
Provstgaard Bart Jay and Provstgaard Stacy Lyn
Bought by
Provstgaard Bart Jay and Provstsgaard Stacy Lynn
Home Financials for this Owner
Home Financials are based on the most recent Mortgage that was taken out on this home.
Original Mortgage
$110,100
Interest Rate
7.82%
Create a Home Valuation Report for This Property
The Home Valuation Report is an in-depth analysis detailing your home's value as well as a comparison with similar homes in the area
Home Values in the Area
Average Home Value in this Area
Purchase History
| Date | Buyer | Sale Price | Title Company |
|---|---|---|---|
| Bart And Stacy Provstgaard Living Trust | -- | None Listed On Document | |
| Provstgaard Bart J | -- | Provo Land Title Co | |
| Provstgaard Bart Jay | -- | -- |
Source: Public Records
Mortgage History
| Date | Status | Borrower | Loan Amount |
|---|---|---|---|
| Previous Owner | Provstgaard Bart J | $145,000 | |
| Previous Owner | Provstgaard Bart Jay | $110,100 | |
| Closed | Provstgaard Bart Jay | $34,800 |
Source: Public Records
Tax History
| Year | Tax Paid | Tax Assessment Tax Assessment Total Assessment is a certain percentage of the fair market value that is determined by local assessors to be the total taxable value of land and additions on the property. | Land | Improvement |
|---|---|---|---|---|
| 2023 | $2,462 | $245,990 | $0 | $0 |
| 2022 | $2,354 | $432,600 | $263,700 | $168,900 |
| 2021 | $1,718 | $267,500 | $129,200 | $138,300 |
| 2020 | $1,616 | $244,100 | $112,400 | $131,700 |
| 2019 | $1,564 | $242,000 | $111,800 | $130,200 |
| 2018 | $1,495 | $220,000 | $106,800 | $113,200 |
| 2017 | $1,518 | $122,410 | $0 | $0 |
| 2016 | $1,452 | $114,710 | $0 | $0 |
| 2015 | $1,402 | $108,660 | $0 | $0 |
| 2014 | $1,348 | $104,260 | $0 | $0 |
Source: Public Records
Map
Nearby Homes
- 968 S Canyon Rd
- 981 S Red Barn View Dr
- 854 S Horizon Loop
- 799 S Brubaker Way
- 790 S Brubaker Way
- 949 S Red Cliff Dr
- 907 N 260 W Unit 228
- 880 S Brubaker Way
- 873 S 250 E
- 14975 S Canyon Rd
- 1155 S Red Barn View Dr
- 177 610 S
- 566 S Center St
- 1257 S Bluff St Unit 589
- 1123 S Red Cliff Dr
- 1219 S Raintree Ln
- 538 S 140 W
- 700 S 300 W
- 906 S 300 W
- 14717 S 5200 W
Your Personal Tour Guide
Ask me questions while you tour the home.