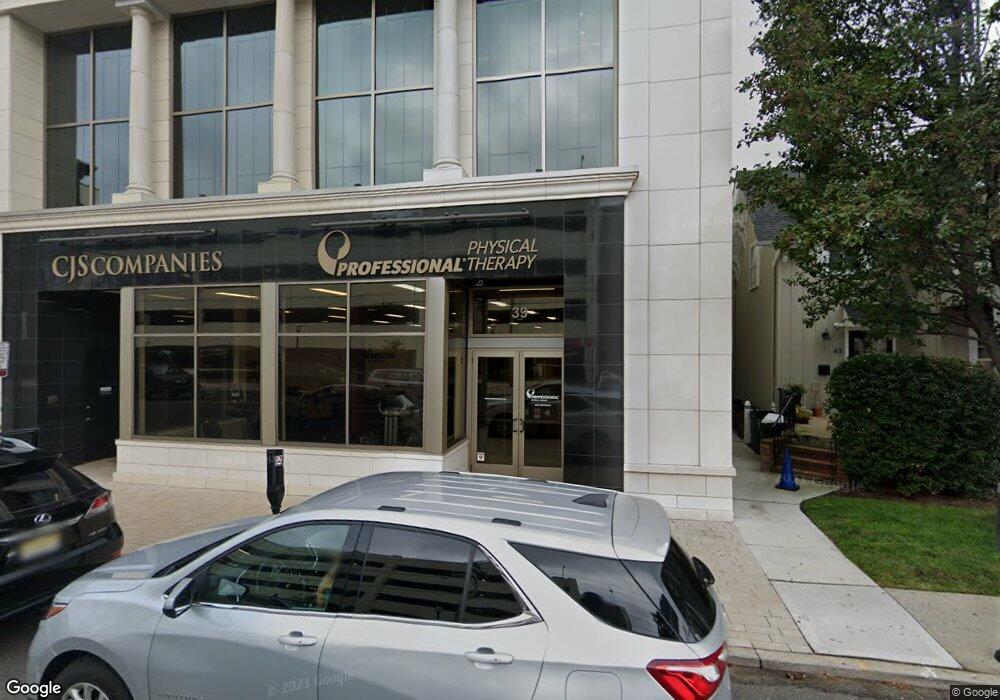
39 E Front St Red Bank, NJ 07701
Estimated Value: $2,323,030
Studio
--
Bath
7,500
Sq Ft
$310/Sq Ft
Est. Value
About This Home
This home is located at 39 E Front St, Red Bank, NJ 07701 and is currently estimated at $2,323,030, approximately $309 per square foot. 39 E Front St is a home located in Monmouth County with nearby schools including Red Bank Primary School, Red Bank Middle School, and Red Bank Regional High School.
Ownership History
Date
Name
Owned For
Owner Type
Purchase Details
Closed on
Aug 30, 2016
Sold by
39 East Front Street Llc
Bought by
Cjs Enterprises Llc
Current Estimated Value
Purchase Details
Closed on
Jun 13, 2014
Sold by
Forman Investments Properties Llc
Bought by
39 E Front Street Llc
Home Financials for this Owner
Home Financials are based on the most recent Mortgage that was taken out on this home.
Original Mortgage
$722,908
Interest Rate
4.16%
Mortgage Type
Commercial
Purchase Details
Closed on
Apr 16, 2013
Sold by
Roentgen Realty Co
Bought by
Forman Investment Properties Llc
Home Financials for this Owner
Home Financials are based on the most recent Mortgage that was taken out on this home.
Original Mortgage
$740,000
Interest Rate
3.45%
Mortgage Type
Construction
Create a Home Valuation Report for This Property
The Home Valuation Report is an in-depth analysis detailing your home's value as well as a comparison with similar homes in the area
Home Values in the Area
Average Home Value in this Area
Purchase History
| Date | Buyer | Sale Price | Title Company |
|---|---|---|---|
| Cjs Enterprises Llc | $1,125,000 | None Available | |
| 39 E Front Street Llc | $361,454 | Alta | |
| Forman Investment Properties Llc | $900,000 | None Available |
Source: Public Records
Mortgage History
| Date | Status | Borrower | Loan Amount |
|---|---|---|---|
| Previous Owner | 39 E Front Street Llc | $722,908 | |
| Previous Owner | Forman Investment Properties Llc | $740,000 |
Source: Public Records
Tax History
| Year | Tax Paid | Tax Assessment Tax Assessment Total Assessment is a certain percentage of the fair market value that is determined by local assessors to be the total taxable value of land and additions on the property. | Land | Improvement |
|---|---|---|---|---|
| 2025 | $33,533 | $1,820,900 | $570,400 | $1,250,500 |
| 2024 | $34,034 | $1,697,000 | $514,400 | $1,182,600 |
| 2023 | $34,034 | $1,700,000 | $517,400 | $1,182,600 |
| 2022 | $46,860 | $2,141,200 | $514,400 | $1,626,800 |
| 2021 | $46,860 | $2,000,000 | $467,600 | $1,532,400 |
| 2020 | $11,129 | $467,600 | $467,600 | $0 |
| 2019 | $10,853 | $467,600 | $467,600 | $0 |
| 2018 | $10,774 | $467,600 | $467,600 | $0 |
| 2017 | $24,886 | $1,123,500 | $467,600 | $655,900 |
| 2016 | $19,917 | $900,000 | $467,600 | $432,400 |
| 2015 | $28,175 | $1,313,500 | $674,400 | $639,100 |
| 2014 | $26,493 | $1,313,500 | $674,400 | $639,100 |
Source: Public Records
Map
Nearby Homes
- 33 Washington St
- 69 Washington St
- 78 W Front St Unit D
- 82 Linden Place
- 44 Hudson Ave
- 48 Hudson Ave
- 50 Hudson Ave
- 28 Riverside Ave Unit 4g
- 58 Hudson Ave
- 64 Hudson Ave
- 70 Hudson Ave
- 152 Manor Dr Unit 1408
- 17 Leroy Place Unit 2B
- 17 Leroy Place Unit 1A
- 98 Manor Dr
- 105 Manor Dr Unit 914
- 24 Irving Place
- 59 Windward Way
- 278 Spring St
- 46 Windward Way
- 37 E Front St Unit C
- 37 E Front St Unit B
- 37 E Front St Unit A
- 37 E Front St
- 55 W Front St Unit 410
- 55 W Front St Unit 407
- 55 W Front St Unit 201
- 55 W Front St Unit 211
- 55 W Front St Unit 302
- 55 W Front St Unit 411
- 55 W Front St Unit 403
- 55 W Front St Unit 301
- 55 W Front St Unit 402
- 55 W Front St Unit 405
- 55 W Front St Unit 408
- 55 W Front St Unit 207
- 55 W Front St Unit 401
- 55 W Front St Unit 203
- 55 W Front St Unit 205
- 55 W Front St Unit 212
Your Personal Tour Guide
Ask me questions while you tour the home.