39 E Main St Salisbury, CT 06068
Salisbury AreaEstimated Value: $554,000 - $1,148,000
About This Home
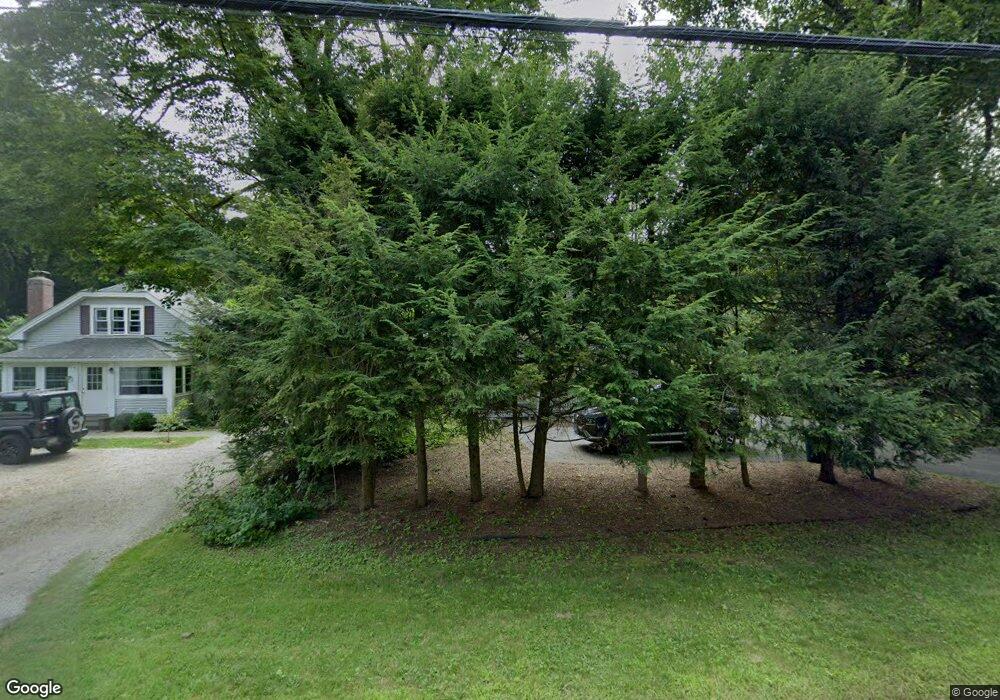
This home is located at 39 E Main St, Salisbury, CT 06068 and is currently estimated at $911,337, approximately $438 per square foot. 39 E Main St is a home located in Litchfield County with nearby schools including Housatonic Valley Regional High School, Indian Mountain School, and Salisbury School.
Ownership History
We collect this data history from publicly available records. To have your information removed, we recommend requesting removal directly through your county’s website.
Purchase Details
Purchase Details
Purchase Details
Home Values in the Area
Average Home Value in this Area
Purchase History
We collect this data history from publicly available records. To have your information removed, we recommend requesting removal directly through your county’s website.
| Date | Buyer | Sale Price | Title Company |
|---|---|---|---|
| $750,000 | -- | ||
| $480,000 | -- | ||
| $212,000 | -- |
Tax History
We collect this data history from publicly available records. To have your information removed, we recommend requesting removal directly through your county’s website.
| Year | Tax Paid | Tax Assessment Tax Assessment Total Assessment is a certain percentage of the fair market value that is determined by local assessors to be the total taxable value of land and additions on the property. | Land | Improvement |
|---|---|---|---|---|
| 2025 | $5,150 | $468,200 | $85,900 | $382,300 |
| 2024 | $5,150 | $468,200 | $85,900 | $382,300 |
| 2023 | $5,150 | $468,200 | $85,900 | $382,300 |
| 2022 | $5,150 | $468,200 | $85,900 | $382,300 |
| 2021 | $5,150 | $468,200 | $85,900 | $382,300 |
| 2020 | $5,420 | $467,200 | $75,600 | $391,600 |
| 2019 | $5,420 | $467,200 | $75,600 | $391,600 |
| 2018 | $5,279 | $467,200 | $75,600 | $391,600 |
| 2017 | $5,186 | $467,200 | $75,600 | $391,600 |
| 2016 | $4,999 | $467,200 | $75,600 | $391,600 |
| 2015 | $4,264 | $398,500 | $85,900 | $312,600 |
| 2014 | $4,539 | $432,300 | $102,300 | $330,000 |
Map
- 47 E Main St
- 58 Main St
- 61 E Main St
- 0 Under Mountain Rd
- 22 Under Mountain Rd
- 87 Canaan Rd Unit 3F
- 11 Prospect Mountain Rd
- 175 Main St
- 5 Prospect Mountain Rd
- 96 Bunker Hill Rd
- 22 Walton St
- 2 Perry St
- 33 Wells Hill Rd
- 31 Belgo Rd
- 243 Wells Hill Rd
- 158 Taconic Rd
- 00 Scoville Ore Mine Rd
- 40 Canterbury Ln
- 406 Wells Hill Rd
- 94 Washinee Heights Rd
Ask me questions while you tour the home.