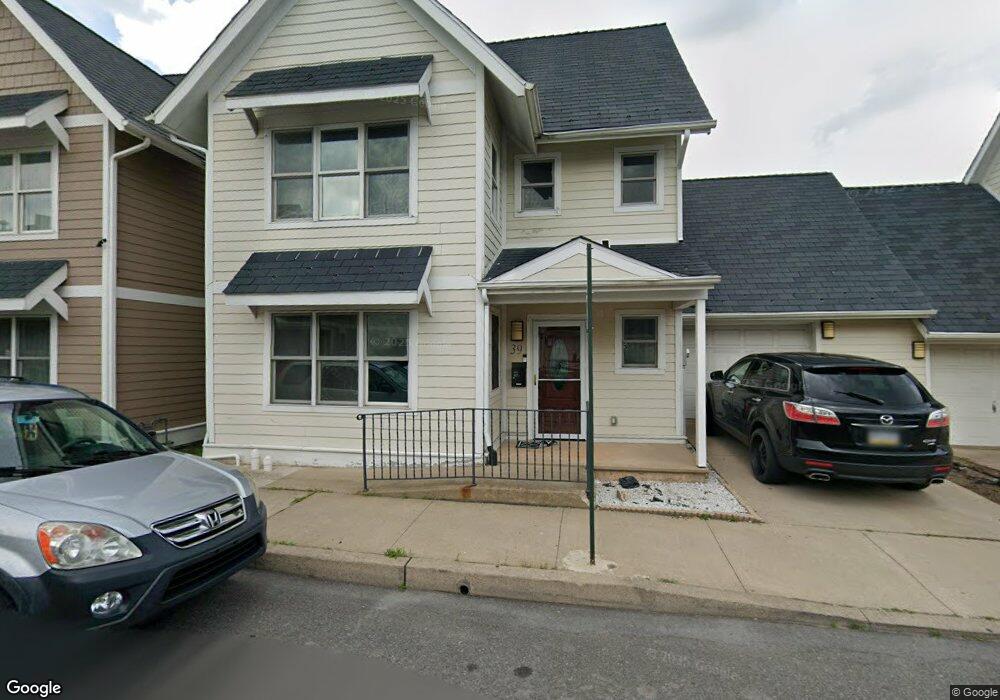
39 E Maple St Hazleton, PA 18201
Estimated Value: $216,000 - $319,000
4
Beds
2
Baths
1,555
Sq Ft
$173/Sq Ft
Est. Value
About This Home
This home is located at 39 E Maple St, Hazleton, PA 18201 and is currently estimated at $269,633, approximately $173 per square foot. 39 E Maple St is a home located in Luzerne County with nearby schools including Hazleton Area High School, Holy Family Academy, and Immanuel Christian School.
Ownership History
Date
Name
Owned For
Owner Type
Purchase Details
Closed on
Apr 23, 2021
Sold by
Brito Jose A
Bought by
Sosa Juan Maria Gomez and Sosa Jose Antonio
Current Estimated Value
Home Financials for this Owner
Home Financials are based on the most recent Mortgage that was taken out on this home.
Original Mortgage
$180,500
Outstanding Balance
$161,335
Interest Rate
3.05%
Mortgage Type
New Conventional
Estimated Equity
$108,298
Purchase Details
Closed on
Apr 23, 2014
Sold by
Deutshe Bank National Trust Company
Bought by
Brito Jose A
Home Financials for this Owner
Home Financials are based on the most recent Mortgage that was taken out on this home.
Original Mortgage
$51,975
Interest Rate
4.27%
Mortgage Type
New Conventional
Purchase Details
Closed on
Sep 28, 2006
Sold by
Helock Edward and Helock Catherine A
Bought by
Santana Tommy Rosado and Santana Dulce
Home Financials for this Owner
Home Financials are based on the most recent Mortgage that was taken out on this home.
Original Mortgage
$115,900
Interest Rate
10.84%
Mortgage Type
Assumption
Create a Home Valuation Report for This Property
The Home Valuation Report is an in-depth analysis detailing your home's value as well as a comparison with similar homes in the area
Home Values in the Area
Average Home Value in this Area
Purchase History
| Date | Buyer | Sale Price | Title Company |
|---|---|---|---|
| Sosa Juan Maria Gomez | $190,000 | None Available | |
| Brito Jose A | $57,750 | None Available | |
| Santana Tommy Rosado | $122,000 | None Available |
Source: Public Records
Mortgage History
| Date | Status | Borrower | Loan Amount |
|---|---|---|---|
| Open | Sosa Juan Maria Gomez | $180,500 | |
| Previous Owner | Brito Jose A | $51,975 | |
| Previous Owner | Santana Tommy Rosado | $115,900 |
Source: Public Records
Tax History
| Year | Tax Paid | Tax Assessment Tax Assessment Total Assessment is a certain percentage of the fair market value that is determined by local assessors to be the total taxable value of land and additions on the property. | Land | Improvement |
|---|---|---|---|---|
| 2026 | $2,910 | $141,700 | $23,600 | $118,100 |
| 2025 | $4,070 | $141,700 | $23,600 | $118,100 |
| 2024 | $3,813 | $141,700 | $23,600 | $118,100 |
| 2023 | $3,565 | $141,700 | $23,600 | $118,100 |
| 2022 | $3,539 | $141,700 | $23,600 | $118,100 |
| 2021 | $3,457 | $141,700 | $23,600 | $118,100 |
| 2020 | $3,089 | $141,700 | $23,600 | $118,100 |
| 2019 | $3,187 | $141,700 | $23,600 | $118,100 |
| 2018 | $3,079 | $141,700 | $23,600 | $118,100 |
| 2017 | $2,838 | $141,700 | $23,600 | $118,100 |
| 2016 | $1,633 | $141,700 | $23,600 | $118,100 |
| 2015 | $1,601 | $141,700 | $23,600 | $118,100 |
| 2014 | $1,601 | $141,700 | $23,600 | $118,100 |
Source: Public Records
Map
Nearby Homes
- 52 N Laurel St
- 116 N Laurel St
- 187 N Church St
- ER.126 W Aspen St
- 101 S Wyoming St
- 418 E Mine St
- 116 S Poplar St
- 424 E Cranberry Ave
- 360 W Spruce St
- 325 E Elm St
- 302 HF4 Canoe Birch
- 14 W 4th St
- 193 S Cedar St
- Lot 46 Mountain Laurel Dr
- 14 Nicole Ln
- 403 W 7th St
- 522 Freemont Ct
- 7 W Diamond Ave
- 1 W Diamond Ave
- 347 Muir Ave
Your Personal Tour Guide
Ask me questions while you tour the home.