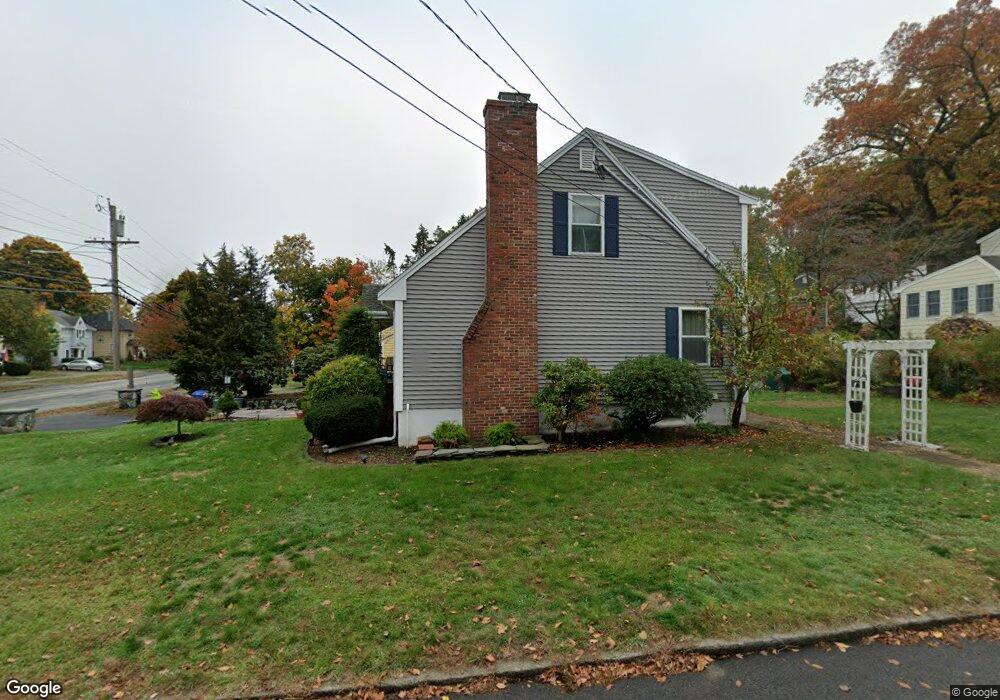
39 Elm St Wakefield, MA 01880
West Side NeighborhoodEstimated Value: $736,000 - $928,000
4
Beds
3
Baths
2,205
Sq Ft
$390/Sq Ft
Est. Value
About This Home
This home is located at 39 Elm St, Wakefield, MA 01880 and is currently estimated at $860,352, approximately $390 per square foot. 39 Elm St is a home located in Middlesex County with nearby schools including Wakefield Memorial High School and St Joseph School.
Ownership History
Date
Name
Owned For
Owner Type
Purchase Details
Closed on
Mar 2, 2015
Sold by
Chankhour Zafer and Chankhour Lara
Bought by
Banerjee Kaustuv and Chekmasova Alena A
Current Estimated Value
Home Financials for this Owner
Home Financials are based on the most recent Mortgage that was taken out on this home.
Original Mortgage
$416,000
Outstanding Balance
$311,778
Interest Rate
3.66%
Mortgage Type
New Conventional
Estimated Equity
$548,574
Purchase Details
Closed on
Dec 28, 2005
Sold by
Hazel R Horovitz and Hazel Horovitz
Bought by
Chankhour Zafer
Home Financials for this Owner
Home Financials are based on the most recent Mortgage that was taken out on this home.
Original Mortgage
$236,500
Interest Rate
6.39%
Mortgage Type
Purchase Money Mortgage
Purchase Details
Closed on
Feb 19, 2004
Sold by
Horovitz Hazel
Bought by
Hazel R Horovitz
Create a Home Valuation Report for This Property
The Home Valuation Report is an in-depth analysis detailing your home's value as well as a comparison with similar homes in the area
Home Values in the Area
Average Home Value in this Area
Purchase History
We collect this data history from publicly available records. To have your information removed, we recommend requesting removal directly through your county’s website.
| Date | Buyer | Sale Price | Title Company |
|---|---|---|---|
| Banerjee Kaustuv | $520,000 | -- | |
| Chankhour Zafer | $386,500 | -- | |
| Chankhour Zafer | $386,500 | -- | |
| Hazel R Horovitz | -- | -- | |
| Hazel R Horovitz | -- | -- |
Source: Public Records
Mortgage History
We collect this data history from publicly available records. To have your information removed, we recommend requesting removal directly through your county’s website.
| Date | Status | Borrower | Loan Amount |
|---|---|---|---|
| Open | Banerjee Kaustuv | $416,000 | |
| Previous Owner | Hazel R Horovitz | $100,000 | |
| Previous Owner | Hazel R Horovitz | $233,000 | |
| Previous Owner | Chankhour Zafer | $236,500 |
Source: Public Records
Tax History
| Year | Tax Paid | Tax Assessment Tax Assessment Total Assessment is a certain percentage of the fair market value that is determined by local assessors to be the total taxable value of land and additions on the property. | Land | Improvement |
|---|---|---|---|---|
| 2025 | $8,357 | $736,300 | $353,000 | $383,300 |
| 2024 | $8,042 | $714,800 | $342,700 | $372,100 |
| 2023 | $7,763 | $661,800 | $317,300 | $344,500 |
| 2022 | $7,412 | $601,600 | $288,400 | $313,200 |
| 2021 | $7,056 | $554,300 | $268,000 | $286,300 |
| 2020 | $6,786 | $531,400 | $256,900 | $274,500 |
| 2019 | $6,583 | $513,100 | $248,100 | $265,000 |
| 2018 | $6,225 | $480,700 | $232,500 | $248,200 |
| 2017 | $5,966 | $457,900 | $221,500 | $236,400 |
| 2016 | $5,771 | $427,800 | $204,700 | $223,100 |
| 2015 | $5,392 | $400,000 | $191,400 | $208,600 |
| 2014 | $4,952 | $387,500 | $185,400 | $202,100 |
Source: Public Records
Map
Nearby Homes
- 13 Parker Rd
- 3 Walnut St
- 284 Main St
- 26-26A Richardson Ave
- 175 North Ave Unit 407
- 62 Foundry St Unit 312
- 62 Foundry St Unit 505
- 62 Foundry St Unit 202
- 7 Ballister St Unit 428
- 20 Lawrence St Unit 2
- 293 Albion St
- 84 Converse St
- 47 Winship Dr
- 1 Summit Dr Unit 24
- 1 Summit Dr Unit 58
- 1 Summit Dr Unit 57
- 6 Highland St
- 159 Broadway St
- 4 Wakefield Ave Unit 4
- 346 Albion St
Your Personal Tour Guide
Ask me questions while you tour the home.