39 Graham Rd Broad Brook, CT 06016
Estimated Value: $334,000 - $432,000
About This Home
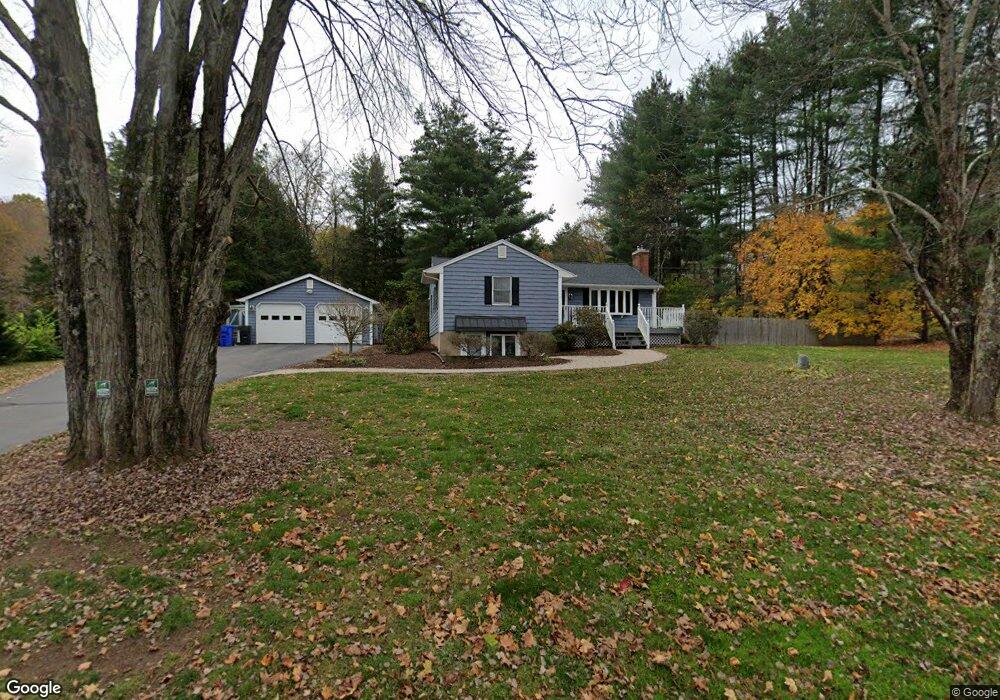
This home is located at 39 Graham Rd, Broad Brook, CT 06016 and is currently estimated at $369,877, approximately $336 per square foot. 39 Graham Rd is a home located in Hartford County with nearby schools including Broad Brook Elementary School, East Windsor Middle School, and East Windsor High School.
Ownership History
We collect this data history from publicly available records. To have your information removed, we recommend requesting removal directly through your county’s website.
Purchase Details
Home Values in the Area
Average Home Value in this Area
Purchase History
We collect this data history from publicly available records. To have your information removed, we recommend requesting removal directly through your county’s website.
| Date | Buyer | Sale Price | Title Company |
|---|---|---|---|
| $116,000 | -- |
Mortgage History
We collect this data history from publicly available records. To have your information removed, we recommend requesting removal directly through your county’s website.
| Date | Status | Borrower | Loan Amount |
|---|---|---|---|
| Closed | $350,000 | ||
| Closed | $50,000 | ||
| Closed | $44,000 | ||
| Closed | $120,000 |
Tax History
We collect this data history from publicly available records. To have your information removed, we recommend requesting removal directly through your county’s website.
| Year | Tax Paid | Tax Assessment Tax Assessment Total Assessment is a certain percentage of the fair market value that is determined by local assessors to be the total taxable value of land and additions on the property. | Land | Improvement |
|---|---|---|---|---|
| 2025 | $5,619 | $212,120 | $76,040 | $136,080 |
| 2024 | $5,210 | $212,120 | $76,040 | $136,080 |
| 2023 | $4,142 | $120,830 | $53,970 | $66,860 |
| 2022 | $4,154 | $120,830 | $53,970 | $66,860 |
| 2021 | $4,169 | $120,830 | $53,970 | $66,860 |
| 2020 | $4,195 | $120,830 | $53,970 | $66,860 |
| 2019 | $4,138 | $120,830 | $53,970 | $66,860 |
| 2018 | $4,096 | $120,830 | $53,970 | $66,860 |
| 2017 | $4,224 | $128,900 | $64,890 | $64,010 |
| 2016 | $3,987 | $128,900 | $64,890 | $64,010 |
| 2015 | $3,907 | $128,900 | $64,890 | $64,010 |
| 2014 | $3,839 | $128,900 | $64,890 | $64,010 |
Map
- 76 Griffin Rd
- 187 Maskel Rd
- 610 Niederwerfer Rd
- 0 Thrall Rd Unit 24150600
- 40 Overlook Rd
- 48 Brook St
- 99 Joseph Ln
- 110 Joseph Ln
- 269 Griffin Rd
- 277 Windsorville Rd
- 20 Apothecaries Hall Rd
- 368 Rye St
- 0 Chamberlain Rd Unit 24154561
- 89 Windsorville Rd
- 3 Garnet Ln
- 435 Abbe Road Extension
- 0 Ellsworth Rd
- 25 Chase Farm Rd
- 7 Chase Farm Rd
- 25 Doria Ln
Ask me questions while you tour the home.