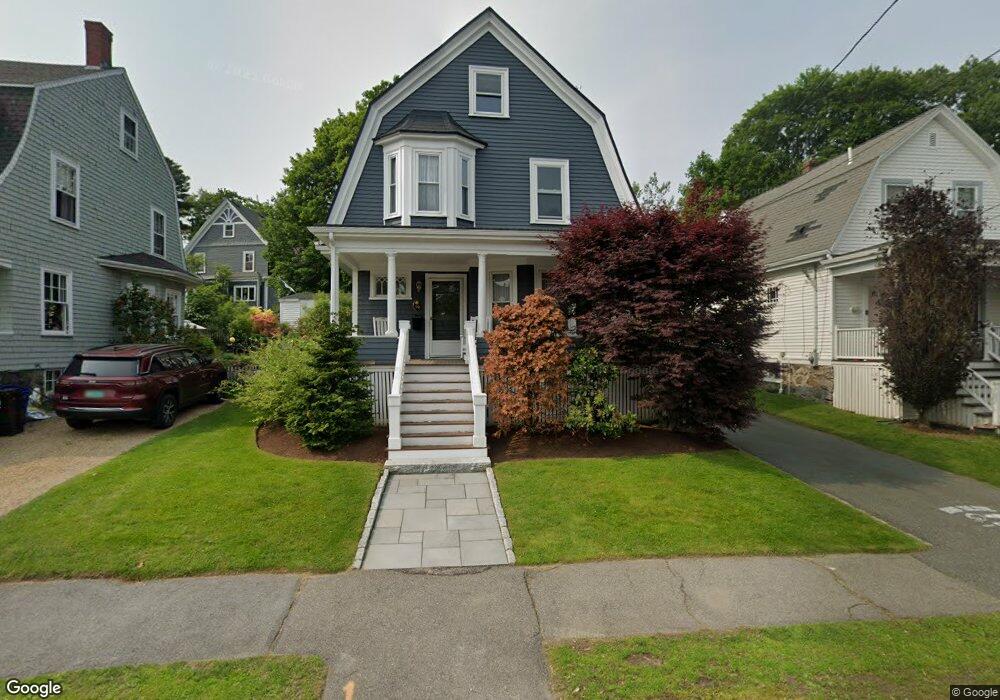
39 Grant Rd Swampscott, MA 01907
Estimated Value: $896,000 - $1,000,000
4
Beds
2
Baths
1,955
Sq Ft
$479/Sq Ft
Est. Value
About This Home
This home is located at 39 Grant Rd, Swampscott, MA 01907 and is currently estimated at $936,476, approximately $479 per square foot. 39 Grant Rd is a home located in Essex County with nearby schools including Swampscott Middle School and Swampscott High School.
Ownership History
Date
Name
Owned For
Owner Type
Purchase Details
Closed on
Apr 20, 2007
Sold by
Bartram Paul L and Bartram Stephanie I
Bought by
Krippendorf Patricia
Current Estimated Value
Home Financials for this Owner
Home Financials are based on the most recent Mortgage that was taken out on this home.
Original Mortgage
$375,000
Interest Rate
6.19%
Mortgage Type
Purchase Money Mortgage
Purchase Details
Closed on
Dec 28, 1995
Sold by
Bartram David G and Bartram Dorothy
Bought by
Bartram Paul L
Create a Home Valuation Report for This Property
The Home Valuation Report is an in-depth analysis detailing your home's value as well as a comparison with similar homes in the area
Home Values in the Area
Average Home Value in this Area
Purchase History
We collect this data history from publicly available records. To have your information removed, we recommend requesting removal directly through your county’s website.
| Date | Buyer | Sale Price | Title Company |
|---|---|---|---|
| Krippendorf Patricia | $475,000 | -- | |
| Krippendorf Patricia | $475,000 | -- | |
| Bartram Paul L | $209,000 | -- | |
| Bartram Paul L | $209,000 | -- |
Source: Public Records
Mortgage History
We collect this data history from publicly available records. To have your information removed, we recommend requesting removal directly through your county’s website.
| Date | Status | Borrower | Loan Amount |
|---|---|---|---|
| Open | Bartram Paul L | $360,000 | |
| Closed | Bartram Paul L | $375,000 |
Source: Public Records
Tax History
| Year | Tax Paid | Tax Assessment Tax Assessment Total Assessment is a certain percentage of the fair market value that is determined by local assessors to be the total taxable value of land and additions on the property. | Land | Improvement |
|---|---|---|---|---|
| 2025 | $9,100 | $793,400 | $344,600 | $448,800 |
| 2024 | $8,876 | $772,500 | $327,800 | $444,700 |
| 2023 | $8,205 | $698,900 | $294,200 | $404,700 |
| 2022 | $7,787 | $606,900 | $252,100 | $354,800 |
| 2021 | $7,678 | $556,400 | $235,300 | $321,100 |
| 2020 | $7,526 | $526,300 | $210,100 | $316,200 |
| 2019 | $7,681 | $505,300 | $189,100 | $316,200 |
| 2018 | $7,435 | $464,700 | $172,300 | $292,400 |
| 2017 | $7,507 | $430,200 | $161,400 | $268,800 |
| 2016 | $7,455 | $430,200 | $161,400 | $268,800 |
| 2015 | $7,378 | $430,200 | $161,400 | $268,800 |
| 2014 | $6,683 | $357,400 | $134,500 | $222,900 |
Source: Public Records
Map
Nearby Homes
- 84 Greenwood Ave
- 5 Lexington Park
- 6 Elmwood Rd
- 2 Ellis Terrace
- 187 Burrill St Unit 2
- 143 Burrill St Unit 301
- 104-106 Burrill St
- 146 Burrill St
- 11 Boynton St Unit 101
- 11 Boynton St Unit 202
- 11 Boynton St Unit 201
- 28 Claremont Terrace Unit 6
- 29 Edgehill Rd
- 481 Humphrey St
- 53 Puritan Rd
- 96 Burpee Rd Unit 1
- 8 Essex St
- 49 Ocean View Rd
- 90 Puritan Rd
- 13 Essex St Unit 2
Your Personal Tour Guide
Ask me questions while you tour the home.