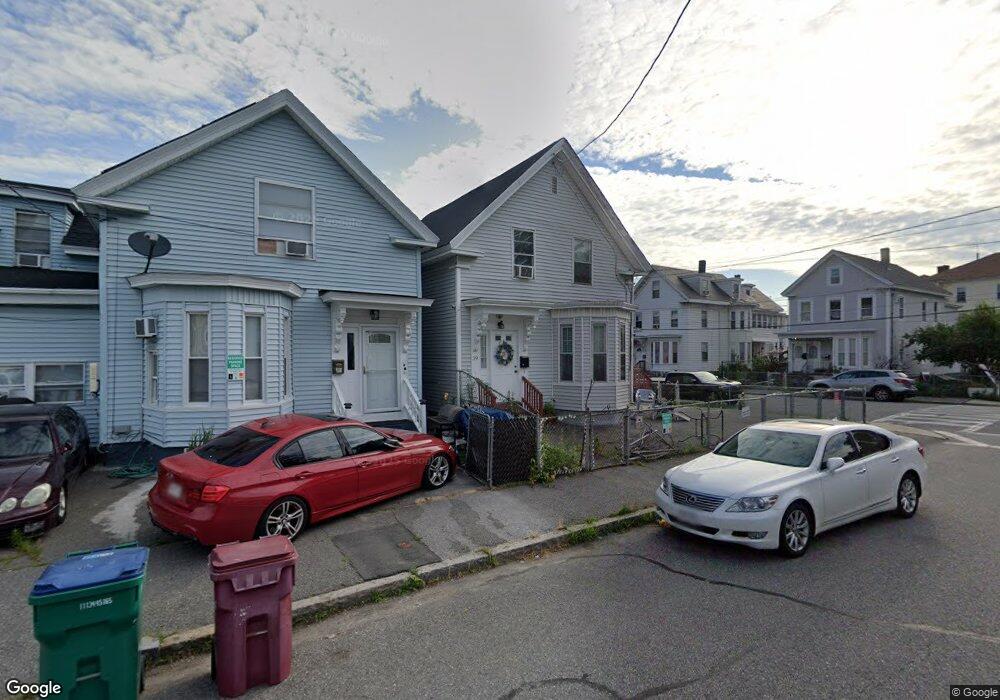
39 Grove St Lowell, MA 01851
Lower Highlands NeighborhoodEstimated Value: $435,000 - $487,000
5
Beds
2
Baths
1,442
Sq Ft
$324/Sq Ft
Est. Value
About This Home
This home is located at 39 Grove St, Lowell, MA 01851 and is currently estimated at $467,482, approximately $324 per square foot. 39 Grove St is a home located in Middlesex County with nearby schools including Charles W. Morey Elementary School, Abraham Lincoln Elementary School, and Charlotte M. Murkland Elementary School.
Ownership History
Date
Name
Owned For
Owner Type
Purchase Details
Closed on
Nov 30, 2020
Sold by
Dragon-Sok Sonny
Bought by
Ang Try
Current Estimated Value
Home Financials for this Owner
Home Financials are based on the most recent Mortgage that was taken out on this home.
Original Mortgage
$297,350
Outstanding Balance
$265,202
Interest Rate
2.8%
Mortgage Type
New Conventional
Estimated Equity
$202,280
Purchase Details
Closed on
Oct 13, 2020
Sold by
Sok Oun
Bought by
Dragon-Sok Sonny
Home Financials for this Owner
Home Financials are based on the most recent Mortgage that was taken out on this home.
Original Mortgage
$297,350
Outstanding Balance
$265,202
Interest Rate
2.8%
Mortgage Type
New Conventional
Estimated Equity
$202,280
Purchase Details
Closed on
Apr 1, 2008
Sold by
Lasalle Bk
Bought by
Caten Neal
Home Financials for this Owner
Home Financials are based on the most recent Mortgage that was taken out on this home.
Original Mortgage
$110,700
Interest Rate
5.76%
Mortgage Type
Purchase Money Mortgage
Purchase Details
Closed on
Jul 1, 1994
Sold by
Murphy Jeffrey and Foley Janet
Bought by
Sok Oun
Home Financials for this Owner
Home Financials are based on the most recent Mortgage that was taken out on this home.
Original Mortgage
$42,250
Interest Rate
8.55%
Mortgage Type
Purchase Money Mortgage
Create a Home Valuation Report for This Property
The Home Valuation Report is an in-depth analysis detailing your home's value as well as a comparison with similar homes in the area
Home Values in the Area
Average Home Value in this Area
Purchase History
We collect this data history from publicly available records. To have your information removed, we recommend requesting removal directly through your county’s website.
| Date | Buyer | Sale Price | Title Company |
|---|---|---|---|
| Ang Try | $313,000 | None Available | |
| Dragon-Sok Sonny | -- | None Available | |
| Dragon-Sok Sonny | -- | None Available | |
| Caten Neal | $123,000 | -- | |
| Caten Neal | $123,000 | -- | |
| Sok Oun | $65,000 | -- | |
| Sok Oun | $65,000 | -- |
Source: Public Records
Mortgage History
We collect this data history from publicly available records. To have your information removed, we recommend requesting removal directly through your county’s website.
| Date | Status | Borrower | Loan Amount |
|---|---|---|---|
| Open | Ang Try | $297,350 | |
| Previous Owner | Caten Neal | $110,700 | |
| Previous Owner | Sok Oun | $42,250 |
Source: Public Records
Tax History
| Year | Tax Paid | Tax Assessment Tax Assessment Total Assessment is a certain percentage of the fair market value that is determined by local assessors to be the total taxable value of land and additions on the property. | Land | Improvement |
|---|---|---|---|---|
| 2025 | $4,530 | $394,600 | $122,500 | $272,100 |
| 2024 | $4,367 | $366,700 | $110,200 | $256,500 |
| 2023 | $4,125 | $332,100 | $95,900 | $236,200 |
| 2022 | $3,818 | $300,900 | $87,200 | $213,700 |
| 2021 | $3,567 | $265,000 | $75,800 | $189,200 |
| 2020 | $3,287 | $246,000 | $66,200 | $179,800 |
| 2019 | $3,026 | $215,500 | $61,300 | $154,200 |
| 2018 | $2,923 | $203,100 | $55,800 | $147,300 |
| 2017 | $2,833 | $189,900 | $50,700 | $139,200 |
| 2016 | $2,673 | $176,300 | $48,300 | $128,000 |
| 2015 | $2,602 | $168,100 | $49,400 | $118,700 |
| 2013 | $2,463 | $164,100 | $59,100 | $105,000 |
Source: Public Records
Map
Nearby Homes
- 1017 Middlesex St Unit 5
- 1036 Middlesex St Unit 9
- 1045 Middlesex St
- 237 Branch St
- 312 Wilder St
- 54 Gates St Unit 2
- 446 Westford St Unit 1
- 68 Liberty St
- 67 S Loring St
- 1159 Middlesex St
- 19 Sheldon St
- 137 Pine St Unit 29
- 710 School St
- 78 Stevens St
- 27 Shaw St
- 255 School St Unit B
- 252 Shaw St
- 42 D St
- 122 S Walker St
- 217 Cross St
Your Personal Tour Guide
Ask me questions while you tour the home.