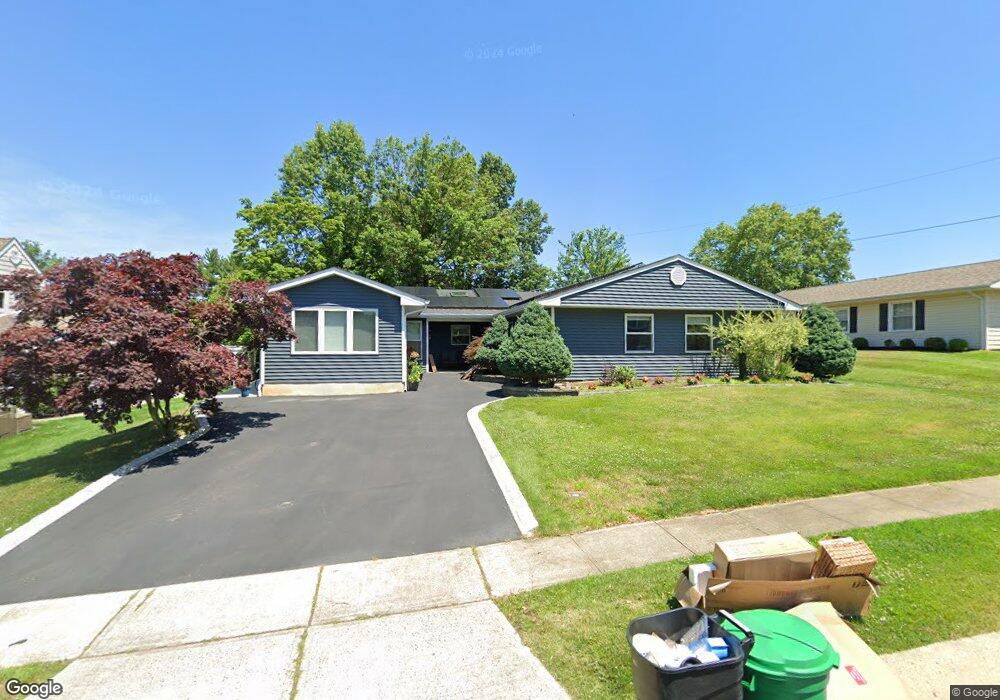
39 Imbrook Ln Matawan, NJ 07747
Estimated Value: $666,550 - $741,000
3
Beds
2
Baths
2,105
Sq Ft
$334/Sq Ft
Est. Value
About This Home
This home is located at 39 Imbrook Ln, Matawan, NJ 07747 and is currently estimated at $703,888, approximately $334 per square foot. 39 Imbrook Ln is a home located in Monmouth County with nearby schools including Matawan Reg High School, St Benedict School, and St. Joseph Elementary School.
Ownership History
Date
Name
Owned For
Owner Type
Purchase Details
Closed on
May 12, 2009
Sold by
Freisen Joseph and Freisen Mary E
Bought by
Bhatt Rohan
Current Estimated Value
Home Financials for this Owner
Home Financials are based on the most recent Mortgage that was taken out on this home.
Original Mortgage
$297,600
Outstanding Balance
$187,727
Interest Rate
4.82%
Mortgage Type
FHA
Estimated Equity
$516,161
Create a Home Valuation Report for This Property
The Home Valuation Report is an in-depth analysis detailing your home's value as well as a comparison with similar homes in the area
Home Values in the Area
Average Home Value in this Area
Purchase History
We collect this data history from publicly available records. To have your information removed, we recommend requesting removal directly through your county’s website.
| Date | Buyer | Sale Price | Title Company |
|---|---|---|---|
| Bhatt Rohan | $325,000 | Fidelity Natl Title Ins Co |
Source: Public Records
Mortgage History
We collect this data history from publicly available records. To have your information removed, we recommend requesting removal directly through your county’s website.
| Date | Status | Borrower | Loan Amount |
|---|---|---|---|
| Open | Bhatt Rohan | $297,600 |
Source: Public Records
Tax History
| Year | Tax Paid | Tax Assessment Tax Assessment Total Assessment is a certain percentage of the fair market value that is determined by local assessors to be the total taxable value of land and additions on the property. | Land | Improvement |
|---|---|---|---|---|
| 2025 | $10,695 | $597,600 | $410,200 | $187,400 |
| 2024 | $10,242 | $529,200 | $345,200 | $184,000 |
| 2023 | $10,242 | $478,800 | $299,100 | $179,700 |
| 2022 | $9,304 | $383,500 | $232,100 | $151,400 |
| 2021 | $9,304 | $344,200 | $209,500 | $134,700 |
| 2020 | $9,515 | $350,600 | $219,000 | $131,600 |
| 2019 | $9,405 | $336,600 | $205,700 | $130,900 |
| 2018 | $8,985 | $322,400 | $197,600 | $124,800 |
| 2017 | $8,986 | $327,000 | $178,600 | $148,400 |
| 2016 | $8,362 | $317,600 | $172,900 | $144,700 |
| 2015 | $8,794 | $320,600 | $179,600 | $141,000 |
| 2014 | $8,366 | $311,000 | $171,000 | $140,000 |
Source: Public Records
Map
Nearby Homes
- 150 Idlebrook Ln
- 287 Church St
- 117 Idolstone Ln
- 40 Icemeadow Ln
- 70 Line Rd
- 3 Christina Ct
- 33 Imperia Place
- 14 Belfast Ave
- 11 Jennifer Dr
- 101 Andover Ln
- 12 Cavan Ln
- 12 Jay Ct
- 100 Dundee Ct
- 76 Bradford Ct
- 23 S Beers St
- 3 Tolas Dr
- 52 Cresci Blvd
- 210 Deerfield Ln
- 242 Perth Hill Ct Unit 242
- 315 Wellington Place
Your Personal Tour Guide
Ask me questions while you tour the home.