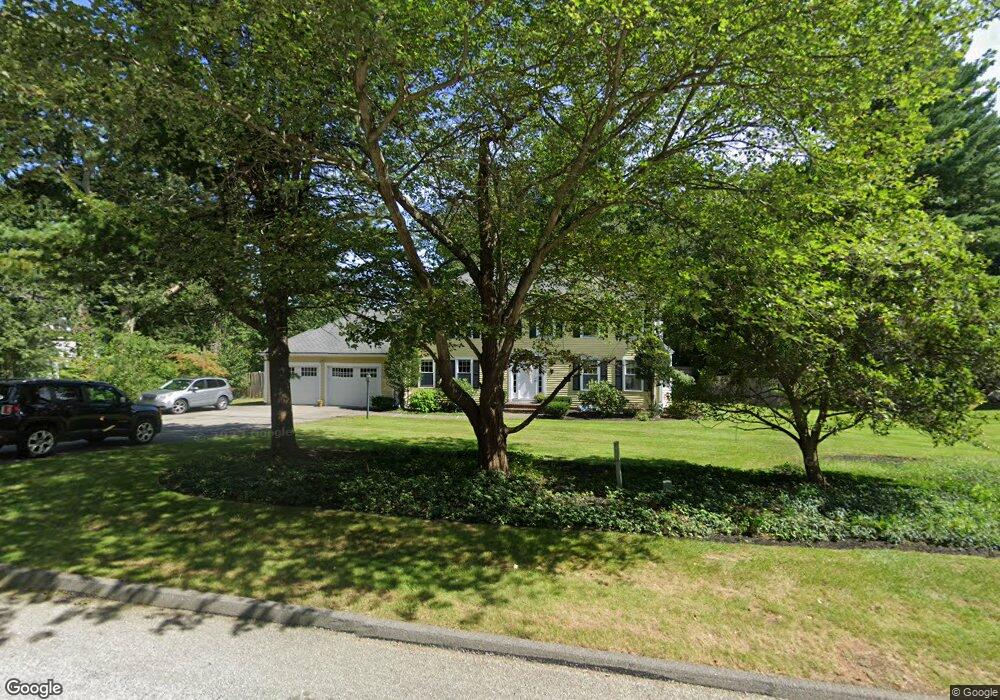
39 Ledgetree Rd Medfield, MA 02052
Estimated Value: $1,162,000 - $1,305,000
4
Beds
3
Baths
2,488
Sq Ft
$487/Sq Ft
Est. Value
About This Home
This home is located at 39 Ledgetree Rd, Medfield, MA 02052 and is currently estimated at $1,212,039, approximately $487 per square foot. 39 Ledgetree Rd is a home located in Norfolk County with nearby schools including Ralph Wheelock School, Memorial School, and Dale Street School.
Ownership History
Date
Name
Owned For
Owner Type
Purchase Details
Closed on
Dec 3, 2002
Sold by
Masterson John and Masterson Donna P
Bought by
Mangiafico Jane
Current Estimated Value
Home Financials for this Owner
Home Financials are based on the most recent Mortgage that was taken out on this home.
Original Mortgage
$300,700
Outstanding Balance
$120,071
Interest Rate
6.16%
Mortgage Type
Purchase Money Mortgage
Estimated Equity
$1,091,968
Purchase Details
Closed on
Jul 23, 1993
Sold by
Williams Robert and Williams Susan L
Bought by
Masterson John and Masterson Donna P
Create a Home Valuation Report for This Property
The Home Valuation Report is an in-depth analysis detailing your home's value as well as a comparison with similar homes in the area
Home Values in the Area
Average Home Value in this Area
Purchase History
We collect this data history from publicly available records. To have your information removed, we recommend requesting removal directly through your county’s website.
| Date | Buyer | Sale Price | Title Company |
|---|---|---|---|
| Mangiafico Jane | $641,500 | -- | |
| Mangiafico Jane | $641,500 | -- | |
| Masterson John | $345,000 | -- | |
| Masterson John H | $345,000 | -- |
Source: Public Records
Mortgage History
We collect this data history from publicly available records. To have your information removed, we recommend requesting removal directly through your county’s website.
| Date | Status | Borrower | Loan Amount |
|---|---|---|---|
| Open | Mangiafico Jane | $300,700 | |
| Closed | Masterson John H | $300,700 | |
| Previous Owner | Masterson John H | $276,000 |
Source: Public Records
Tax History
| Year | Tax Paid | Tax Assessment Tax Assessment Total Assessment is a certain percentage of the fair market value that is determined by local assessors to be the total taxable value of land and additions on the property. | Land | Improvement |
|---|---|---|---|---|
| 2025 | $14,647 | $1,061,400 | $468,400 | $593,000 |
| 2024 | $14,192 | $969,400 | $420,100 | $549,300 |
| 2023 | $13,963 | $904,900 | $402,600 | $502,300 |
| 2022 | $13,675 | $785,000 | $385,100 | $399,900 |
| 2021 | $13,533 | $762,000 | $381,600 | $380,400 |
| 2020 | $13,091 | $734,200 | $372,800 | $361,400 |
| 2019 | $12,961 | $725,300 | $362,300 | $363,000 |
| 2018 | $11,975 | $703,200 | $350,100 | $353,100 |
| 2017 | $11,818 | $699,700 | $346,600 | $353,100 |
| 2016 | $11,720 | $699,700 | $346,600 | $353,100 |
| 2015 | $10,886 | $678,700 | $336,500 | $342,200 |
| 2014 | $9,827 | $609,600 | $297,300 | $312,300 |
Source: Public Records
Map
Nearby Homes
- 6 Hearthstone Dr
- 82 Pleasant St
- 80 Pleasant St
- 22 South St
- 15 Homestead Dr
- 13 Lawrence Cir
- 4 Maple St Unit 4
- 16 Foxhunt Trail
- 19 Haven Rd
- 5 Spring St Unit A
- 92 North St
- 96 County Street Lot 20a
- 18 Emerson Rd
- 23 Winter St
- 2 Lincoln Ct
- 4 Lincoln Ct
- 9 Schaffner Ln
- 3 Shining Valley Cir
- 9 Bridge St
- 58 Hartford St
Your Personal Tour Guide
Ask me questions while you tour the home.